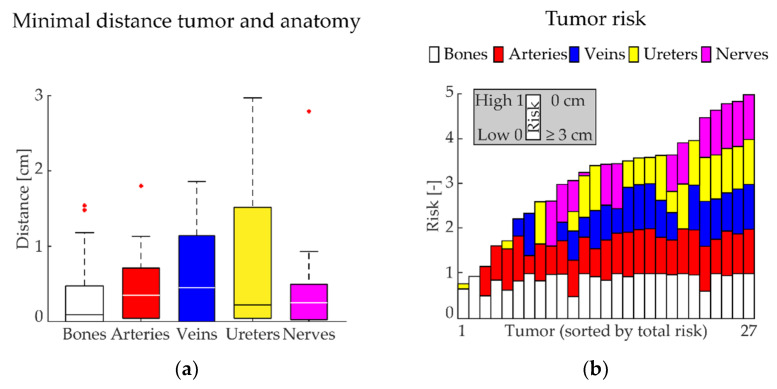
Figure 2.
(a) For each tumor, the shortest distance of the tumor surface to a critical anatomical structure (bones, arteries, veins, ureters, nerves) was calculated. Values are presented as box plots (median: horizontal line within each bar; the bottom of each bar is defined as the 1st quartile; the top of each bar as the 3rd quartile; outliers are the red points). (b) The total risk for each tumor was determined based on this minimal distance. Here, the length of each individual bar is minimal 0 (low risk, which is ≥3 cm between tumor surface and critical anatomical structure) and maximal 1 (high risk, which is a distance of 0 cm between tumor surface and critical anatomical structure). The total risk for each tumor is presented as the sum of all the individual risks.

