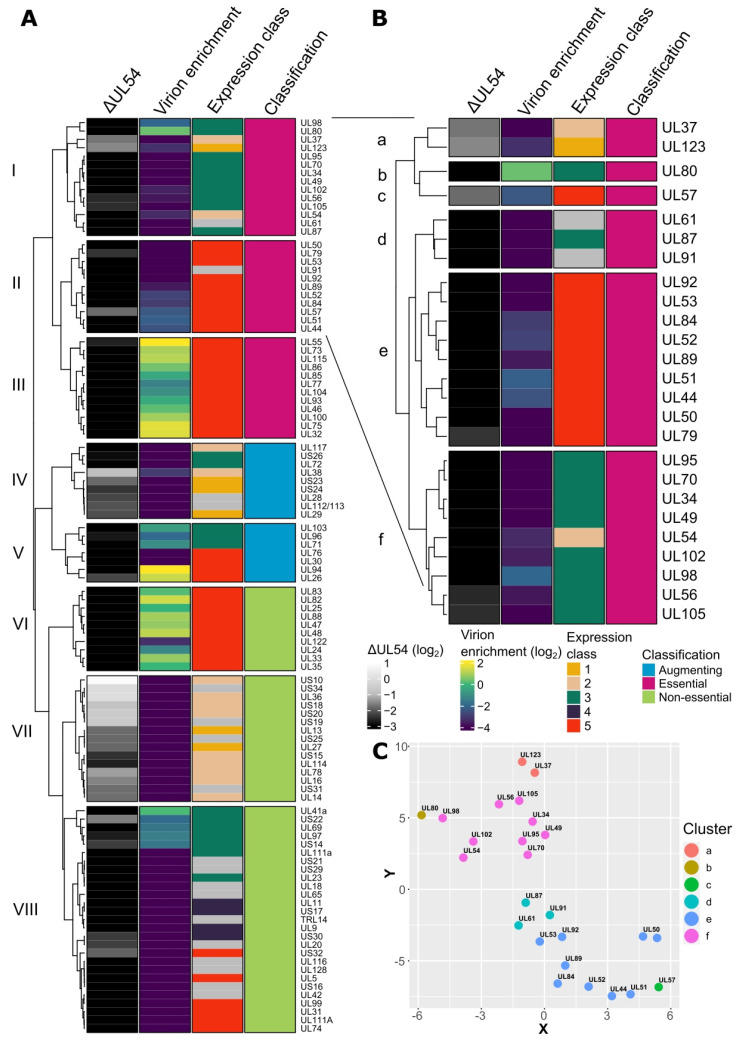
Figure 1.
RNA sequencing and bioinformatics analysis of HCMV genes. (A) Heatmap depicting HCMV gene features based on complete linkage clustering and Gower distance. Columns represent the relative log2 fold-change in transcript abundance in ΔUL54 mutant infections compared to WT at 72 HPI, relative log2 virion enrichment compared to a WT infected cellular lysate at 5 DPI [36] (positive values reflect virion enrichment), kinetic expression classes 1 to 5 based on Weekes et al. [19] and essential/augmenting/non-essential gene classification based on Yu et al. [37]. (B) Heatmap depicting HCMV genes expanded from clusters I and II in (A), and sub-clustered based on complete linkage clustering and Gower distance. (C) t-stochastic neighbour embedding plot of genes from (B).

