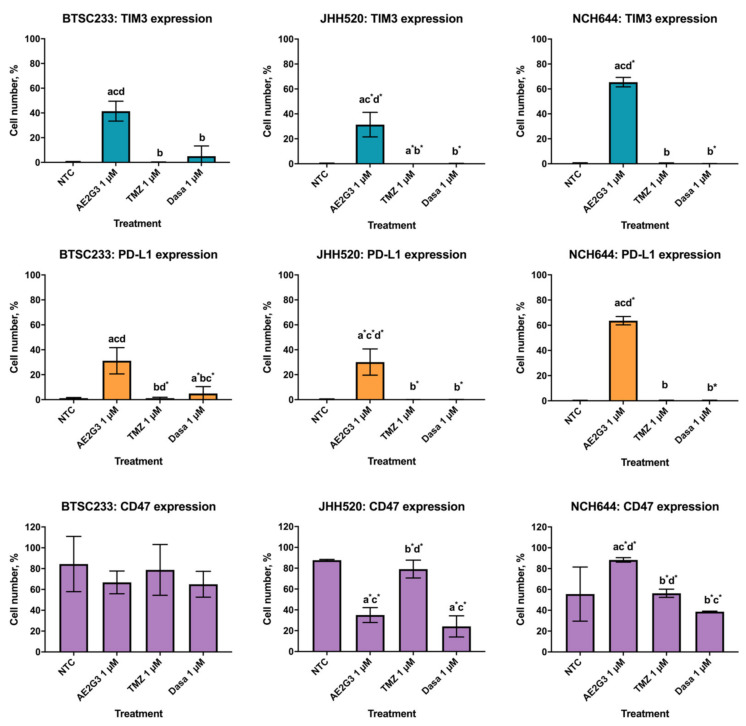
Figure 3.
Evaluation of expression of surface markers (TIM3, PD-L1, CD47) on cells of GSCs cell cultures after treatment of cationic phosphorus dendrimer AE2G3 in comparison with non-treated control (NTC), temozolomide (TMZ) and dasatinib (Dasa). “a” marks significant difference in comparison with NTC, “b” marks significant difference from AE2G3 treatment, “c” marks significant difference with TMZ treatment and the letter “d” marks a significant difference in comparison with Dasa (p < 0.05). Letters with an asterisk * mark the tendency (0.08 < p < 0.05).

