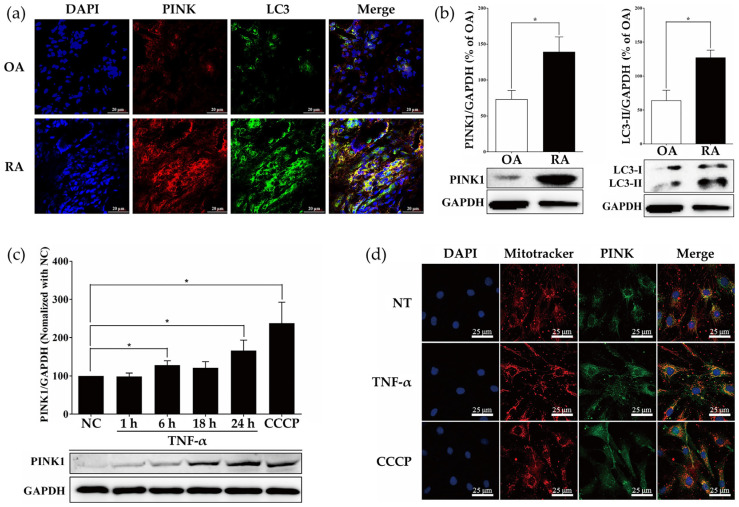
Figure 1.
PINK1 is highly expressed in synovial tissues of rheumatoid arthritis patients and TNF-α-treated RASFs. (a) Immunofluorescence staining for PINK1 (red), LC3B (green), and nuclei (blue) in synovial membranes of OA and RA patients. Scale bar: 20 μm. Images are representative of five images/sample; n = 3 samples/disease group. (b) Tissue Western blots for PINK1 and LC3B-II in human synovial membranes from OA (n = 3) and RA (n = 3) patients. The bar graph shows quantification by densitometry of LC3-II, and PINK1 in synovial membranes from RA and OA patients, presented as means ± SEM (n = 3 independent patient synovial membranes). * p < 0.05. (c) TNF-α (10 ng/mL) induced PINK1 upregulation in a time-dependent manner. RASFs were treated with CCCP (10 μM) for 24 h. PINK1 protein was detected by immunoblotting. The bar graph shows the quantification of PINK1 expression by densitometry in RASFs, expressed as means ± SEM (n = 5 independent RASF preparations/group). * p < 0.05. (d) Immunofluorescence staining for PINK1 (green), mitochondria (red), and nuclei (blue) in RASFs treated with TNF-α for 24 h. Scale bar: 25 μm. Image (original magnification, ×100) is representative of five images/slide, n = 3 slides/treatment group.

