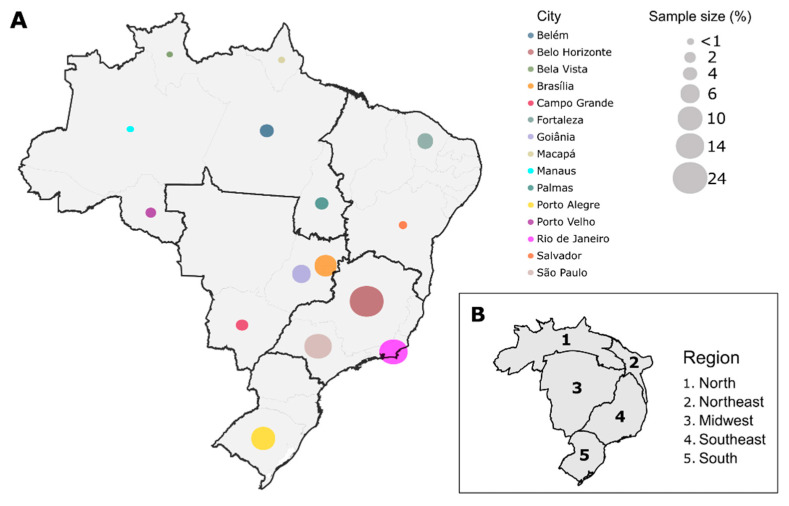
Figure 1.
Schematic representation of study sampling. (A) Samples from 15 different capitals of Brazil, representing the five regions (North, Northeast, Midwest, Southeast, and South) were included in our study. In total, 7549 samples were analyzed and the proportion of samples for each capital is represented by the size of the colored circles. Each color represents a different capital; (B) Cartogram of the sampling representativeness according to the population size of each Brazilian region.

