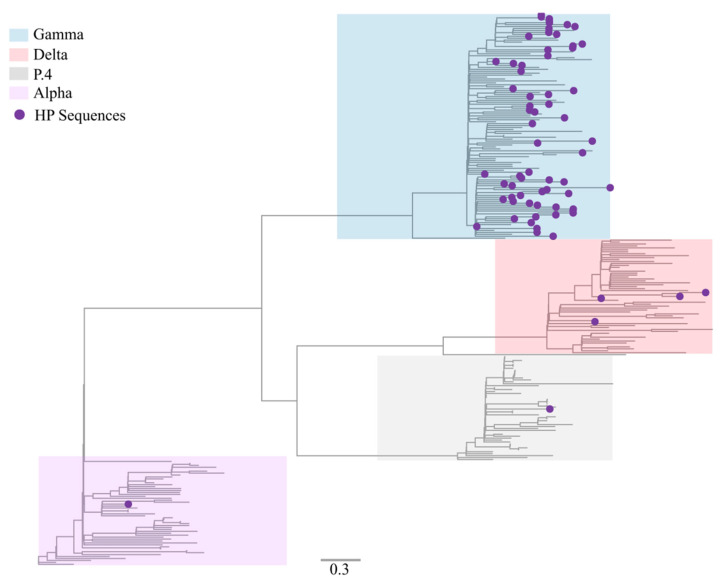
Figure 3.
Maximum likelihood inference tree to confirm lineage classification using a reference dataset. The genomes generated in our study (n = 69) are highlighted with purple circles. Lineages Alpha (B.1.1.7), Gamma (P.1), Delta (B.1.617.2), and P.4 are highlighted in violet, blue, red, and gray, respectively.

