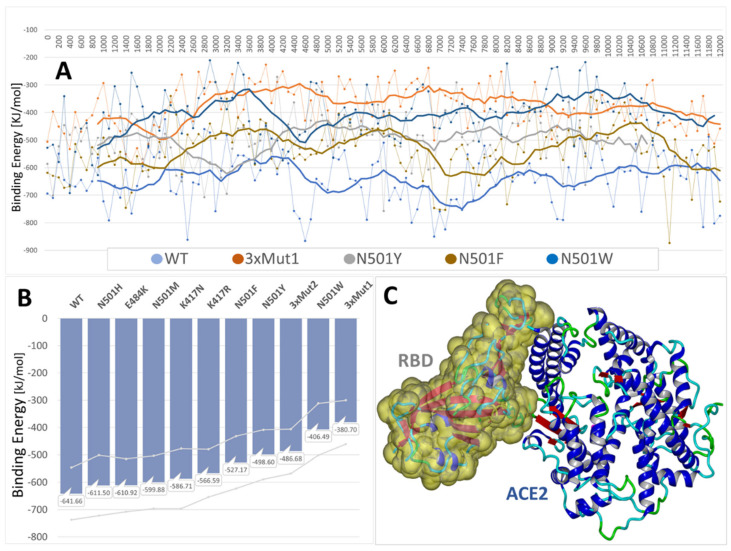
Figure 6.
(A) Comparison of RBD-ACE2 binding energy MD trajectories for five RBD variants. For reasons of visual clarity, only five of the nine MD simulation trajectories are plotted. These included the wild-type strain (WT), the triple mutant “3xMut1” (see below), N501Y, N501F, and N501W. Heavy solid lines are 10-point rolling averages. Thinner lines are binding energy data calculated at 100-ps intervals. The wild-type PDB 6LZG complex and variants thereof were used to perform 12–18 ns of MD simulation in physiological saline at 311OK (NPT ensemble, AMBER-14; initial 12 ns are plotted). Simulations included the following RBD variants: (1) wild-type 6LZG, (2) N501H, (3) E484K, (4) N501M, (5) K417N, (6) K417R, (7) N501Y, (8) triple mutant “3xMut2” harboring N501Y, K417R, and E484K, and (9) triple mutant “3xMut1” harboring N501Y, K417N, and E484K. (B) Average binding energies (vertical bars) and standard deviations (gray lines) over the nine MD trajectories (n = 120–180). (C) RBD-ACE2 complex of 6LZG at t = 0 ns. The RBD fragment is depicted as the Van der Waals surface. Water and NaCl ions have been hidden for clarity.

