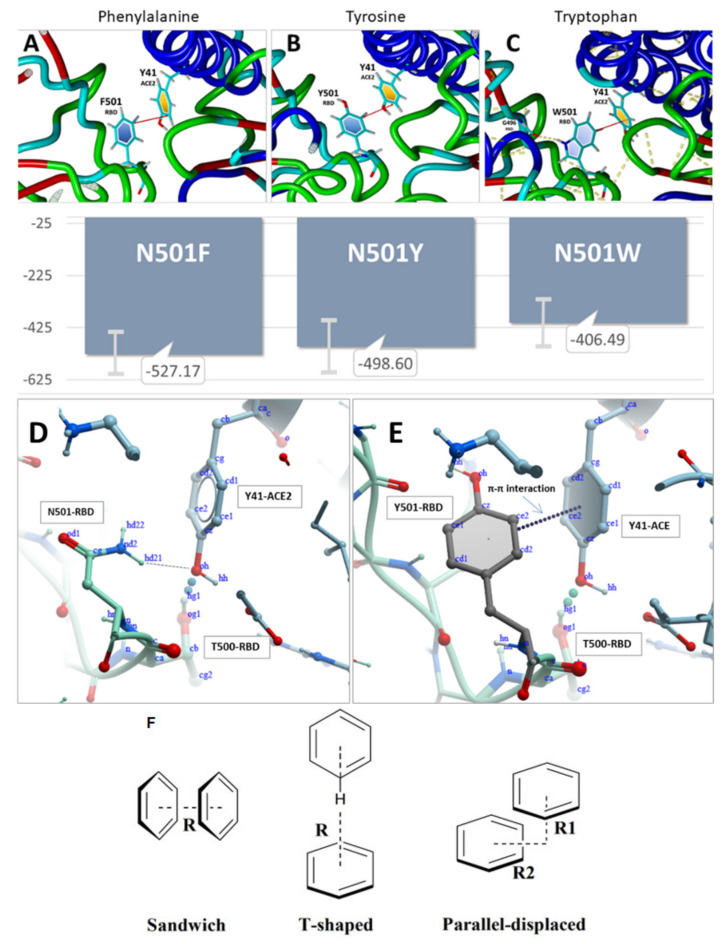
Figure 7.
RBD-ACE2 binding energies (KJ/mol) derived from the MD simulations. N = approximately 120 in each case. Higher (less negative) energies correspond to stronger RBD-ACE2 binding. Upper Panel: Intermolecular π-π interactions (red lines) between Y41 of the ACE2 receptor and (A) phenylalanine (N501F), (B) tyrosine (N501Y), or (C) tryptophan (N501W) substitutions at the N501x position of the SARS-CoV-2 S-protein RBD (PDB entry 6LZG). Each RBD-ACE2 conformation shown was obtained following 9.0 ns of MD equilibration at 311OK in physiological saline. Middle Panel: (D) Hydrogen bonding between donor atom hd21 of N501 of the RBD and the phenyl oxygen acceptor (oh atom) of residue Y41 of the ACE2 receptor. (E) π-π interactions between Y41 of the ACE2 receptor and tyrosine (N501Y) of S-protein RBD. The distances between RBD Residue/Atom and ACE2 Residue/Atom may be viewed in the Supplementary Materials. Lower Panel: (F) Sandwich, T-shaped, and parallel-displaced configurations of the benzene dimer.

