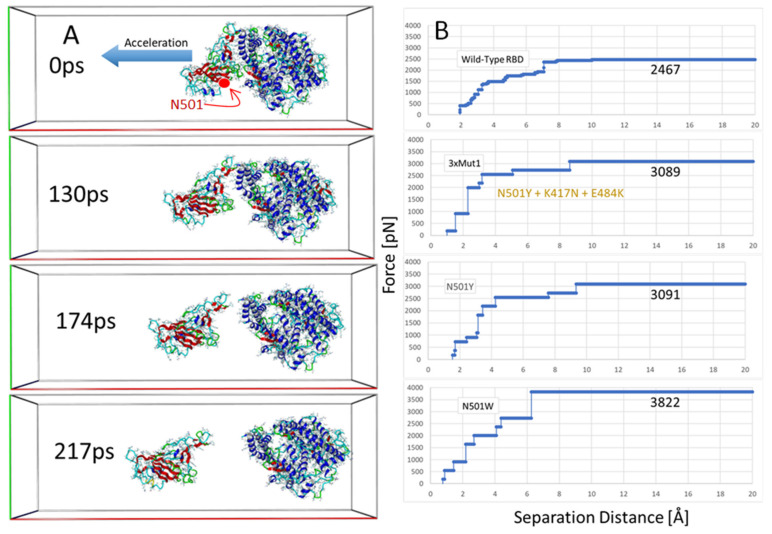
Figure 8.
(A) Frame-captures from the SMD simulation of the wild-type RBD-ACE2 complex (6LZG) showing detachment of the RBD from the tethered ACE2 receptor. Water and NaCl ions have been hidden for clarity. Note that the lower part of the interfacial region near N501 residue locus of the RBD (red arrow) was the first area to undergo complete separation from the ACE2 receptor. The upper region of the interfacial zone furthermost from N501 was the last to undergo separation after about 160–170 ps of elapsed time. (B) Pulling force (pN) as a function of separation distance (Å) for the wild-type 6LZG complex (lower graph), RBD mutant N501W, RBD triple mutant 3xMut1, and RBD mutant N501W.

