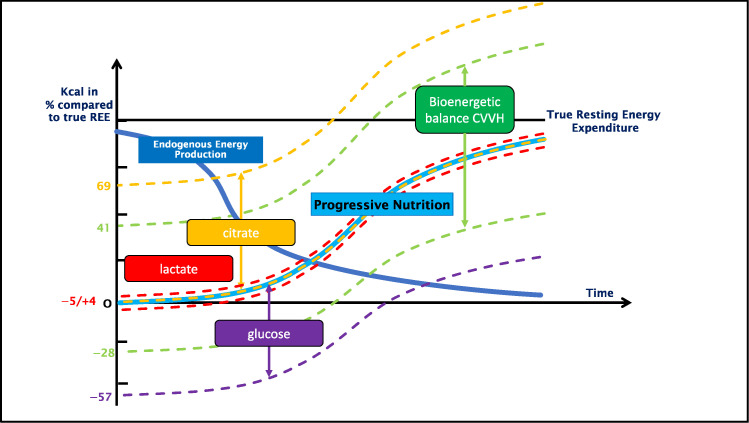
Figure 1.
Bioenergetic balance of the CVVH compared to the true REE in relation to the ideal caloric delivery over time during progressive nutrition. This figure depicts the exchange of citrate, lactate and glucose in percentages compared to the true REE. It is placed against the need for progressive nutrition therapy, as recommended by the ESPEN guidelines [16], in relation to the endogenous energy production due to catabolism. The graph follows the recommendation of progressive nutrition therapy, illustrating the impact on total caloric load if the exchange of the different nutrients was not taken into consideration.

