
FIGURE 8.
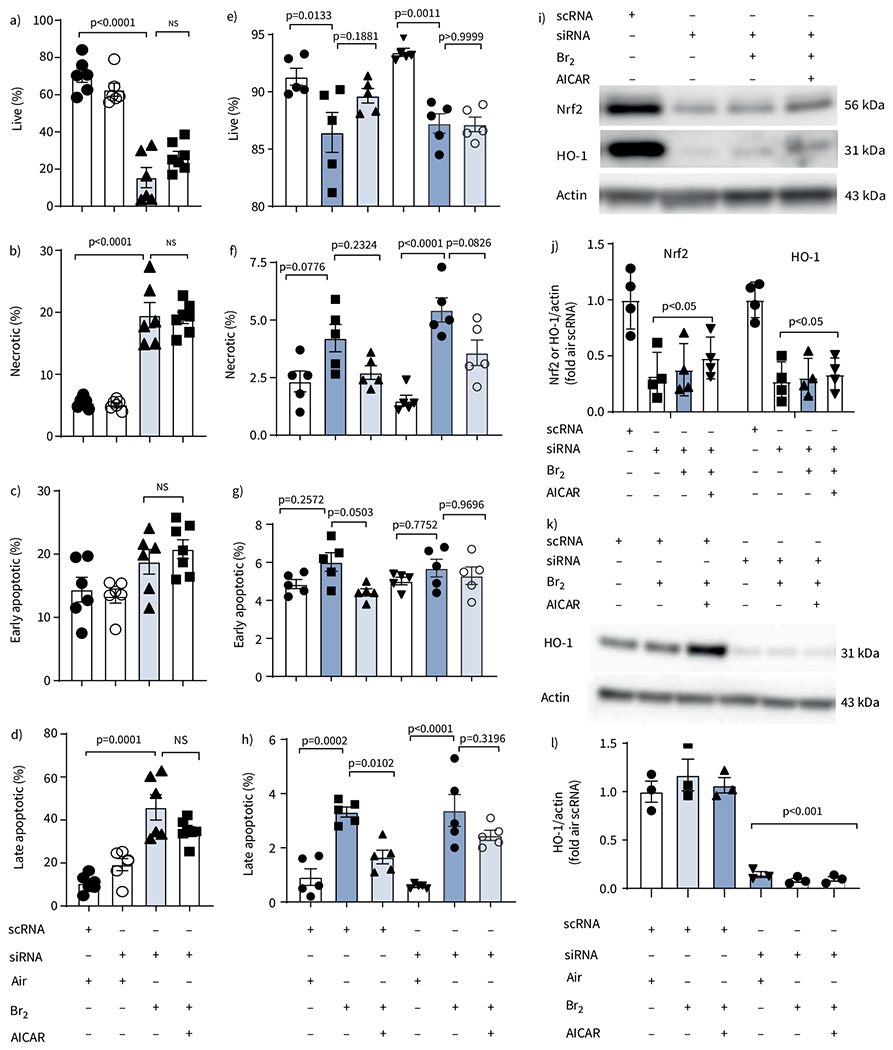
AICAR reduces apoptosis and necrosis following Br2 injury in vitro through heme oxygenase-1 (HO-1) in rat alevolar type II epithelial (L2) cells and human club-like epithelial (H441) cells but not in cells treated with small interfering RNA (siRNA) against nuclear factor erythroid 2-related factor 2 (Nrf2). a–d) Quantification of flow cytometry data from L2 cells treated with scrambled RNA (scRNA) or siRNA against Nrf2. In AICAR-treated cells that received scRNA, all indicators of cell injury were reduced compared to the vehicle-treated Br2 groups. Administration of the siRNA against Nrf2 did not increase the injury after Br2 exposure in vehicle-treated cells, but prevented the protective effects of AICAR seen in the scRNA groups. Data are presented as individual points and mean±sem. Experiments were replicated in triplicate. Significance was determined by one-way ANOVA followed by Tukey’s post hoc test. e–h) Quantification of flow cytometry data from H441 cells treated with scRNA or siRNA against HO-1 and then divided further into three groups: Air, Br2 and Br2+AICAR. In AICAR-treated cells that received the control scRNA, all indicators of cell injury were reduced compared to the vehicle-treated Br2 groups that received the scRNA. Administration of the siRNA against HO-1 did not increase the injury after Br2 exposure in vehicle-treated cells, but prevented the protective effects of AICAR seen in the scRNA groups. Data are presented as individual data points and mean±sem. Experiments repeated in triplicate. Significance was determined by one-way ANOVA followed by Tukey’s post hoc test. i, j) Representative Western blot against Nrf2 and HO-1 after Nrf2 siRNA administration and its quantification in L2 cells. Data are presented as mean±sem, n=4. Significance determined by one-way ANOVA followed by Tukey’s post hoc test. k, l) Representative Western blot against HO-1 after HO-1 siRNA administration and its quantification in H441 cells. Data are presented as mean±sem, n=4. Significance determined by one-way ANOVA followed by Tukey’s post hoc test.