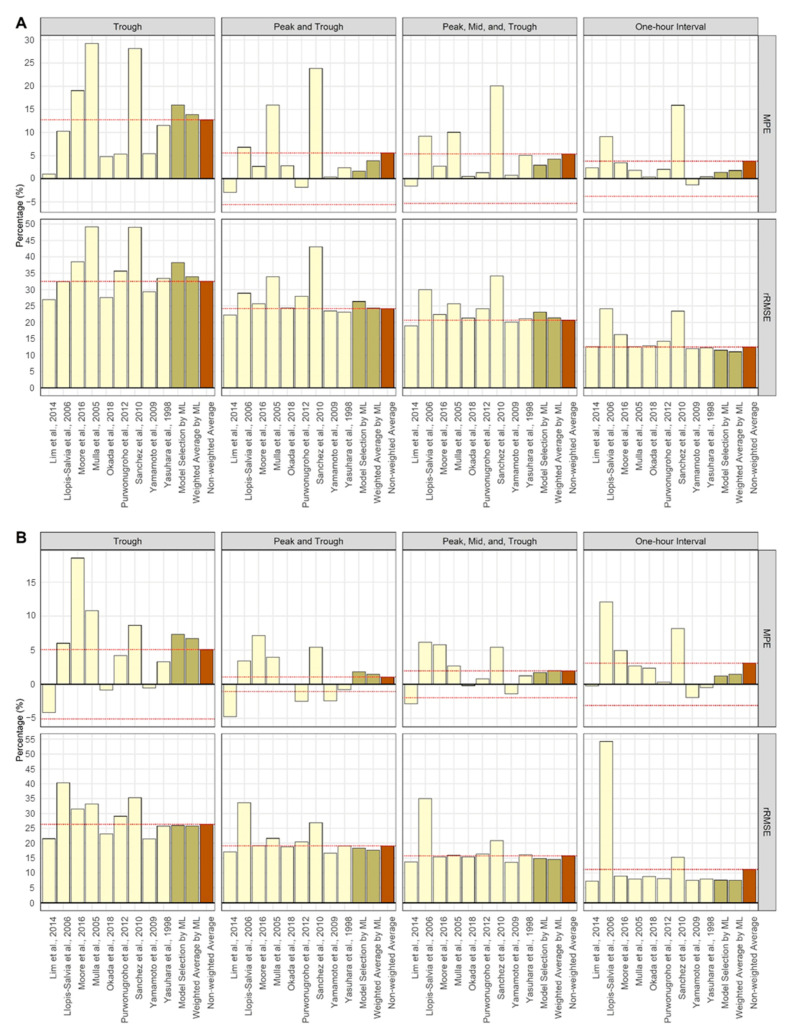
Figure 4.
The mean percent error () and relative root mean squared error () of the predicted AUCs relative to the true AUCs of each simulation scenario for external validation [19,20,21,22,23,24,25,26,27]. The prediction method (using a single model, ML application, and comparison) is distinguished by yellow, olive, and brown colors, respectively. The red dashed horizontal line is the value obtained using the non-weighted average method. (A) Single dose; (B) steady-state.

