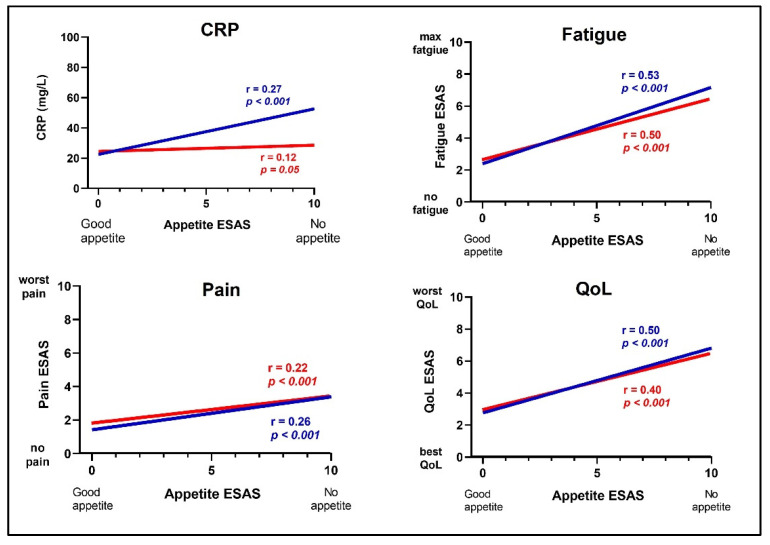
Figure 2.
The relationship between appetite and CRP (n = 530), Quality of life (n = 529), fatigue (n = 530) and pain (n = 530), assessed using ESAS in cancer patients in palliative care; comparison between men (n = 266, blue lines) and women (n = 264, red lines). Spearman’s correlation was used to calculate r- and p-values. ESAS = Edmonton Symptom Assessment System. 0 = no suffering, 10 = unbearable suffering; CRP = C-Reactive protein; QoL = Quality of Life.

