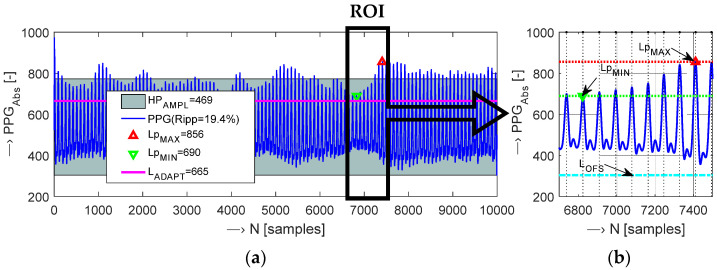
Figure 3.
Visualization of adaptive signal level threshold determination: (a) whole 10-k sample PPG signal with determined LpMAX, LpMIN levels, HPAMPL and heart ripple parameters, and finally calculated LADAPT level, (b) ROI within 80th–89th PPG cycles with localized systolic peaks, determined LpMAX/LpMIN values, and global LOFS value; fs = 100 Hz.

