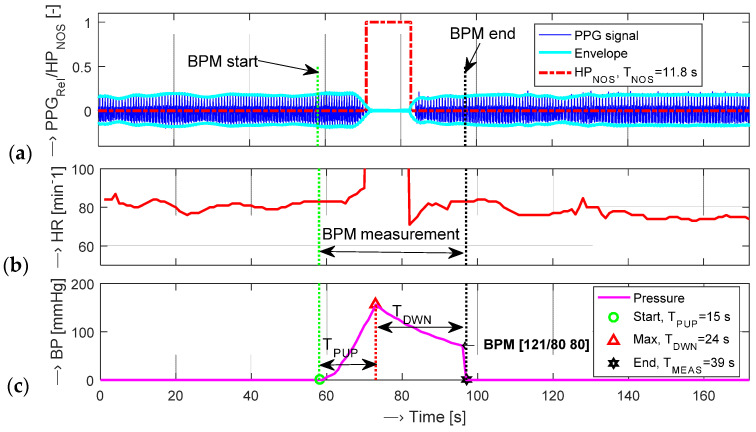
Figure 6.
Visualization of a PPG wave sensed from the left little finger with parallel BP measurement on the same arm: (a) the PPG signal and its envelopes together with determined TNOS ≅ 10 s, (b) HR values determined from the PPG signal, (c) the pressure characteristic measured by the BPM device with determined TPUP, TPDWN, and TPMEAS time intervals, BP and HR values.

