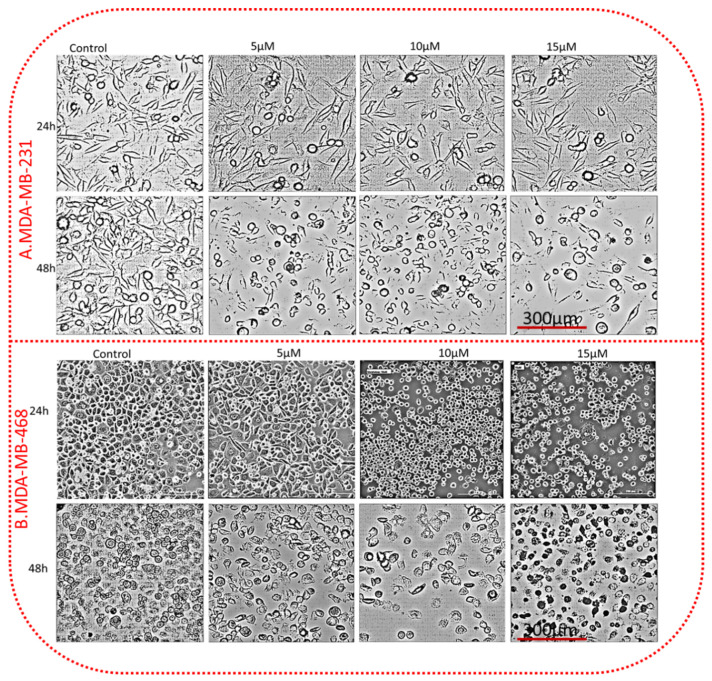
Figure 3.
TQ alters the morphology of TNBC cells. Both cell lines were treated with 5, 10, and 15 µM TQ and control (only media with DMSO) for 24 h. The morphological changes in TQ-treated TNBC cells were visualized by a Cytation5 cell Imaging reader (BioTek Instruments, Inc., Winooski, VT, USA) using a phase-contrast digital microscope. Images represent MDA-MB-231 (A) and MDA-MB-468 (B). The treated cells showed irregular aggregates cells, small and round cells, apoptotic cells, and decreased cell density relative to control. All scale bars indicate 300 µm in 40× magnification.

