Figure 5.
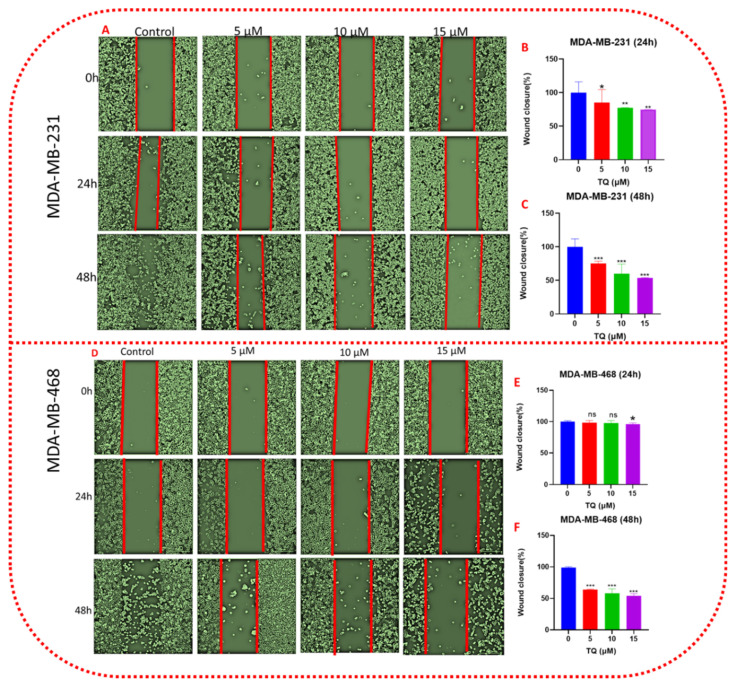
TQ attenuates TNBC cell migration. Figure 5 (A–F) shows a graphical representation of the wound-healing assay after 24 and 48 h in control and treated samples. Cell migration was assessed in MDA-MB-231 and MDA-MB-468 after exposure to TQ at concentrations of 0, 5, 10, and 15 µM. Both cells were treated with TQ for 24 h, and migration was assessed using a wound-healing assay in a 12-well plate (as described in Section 2). MDA-MB-231 (A) and MDA-MB-468 (D) typical phase-contrast pictures of the wound site of control and TQ-treated cultures at 0, 24, and 48 h after treatment. The bar graph presents the concentration–response curves of TQ-treated or control cultures at 24 h and 48 h after processing in ImageJ software, as well as the residual wound area of percent fold change in the wound closure area, (B,C) (MDA-MB-231), and (E,F) (MDA-MB-468). Data presented as the mean ± SEM of three independent experiments, each performed in triplicates, were analyzed using Student’s t-test, * p < 0.05, ** p < 0.01, *** p < 0.001, ns-nonsignificant). All scale bars indicate 300 µm in 10× magnification.

