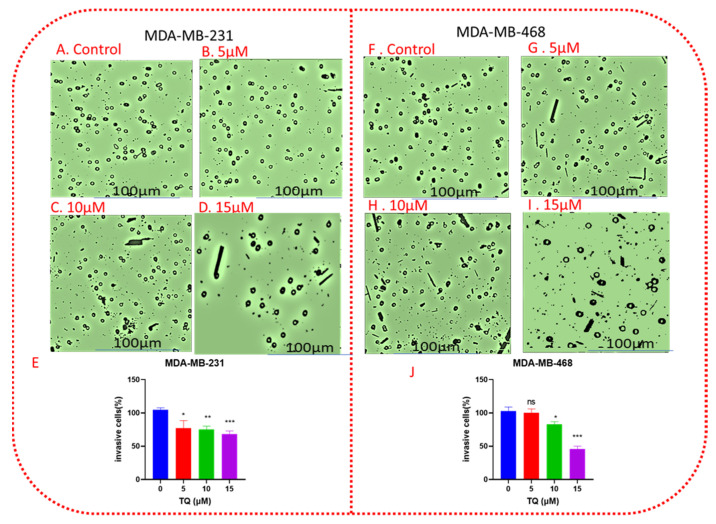
Figure 6.
TQ inhibits TNBC cell invasion. A monolayer of TNBC MDA-MB-231 cells and MDA-MB-468 were treated with DMSO (control), 5, 10, and 15 µΜ for 24 h. Images (A–D,F–I) showed the relative invaded cells to the membrane for MDA-MB-231 and MDA-MB-468 cells, respectively, in a concentration dependent manner. Bar graphs (E,J) show the percentage of invaded cells per insert for the corresponding cell lines. The means ± SEMs of three independent experiments, each performed in triplicates, were analyzed by Student’s t-test. * p < 0.05, ** p < 0.01, *** p < 0.001; ns, nonsignificant. All scale bars indicate 100 µm in 10× magnification.

