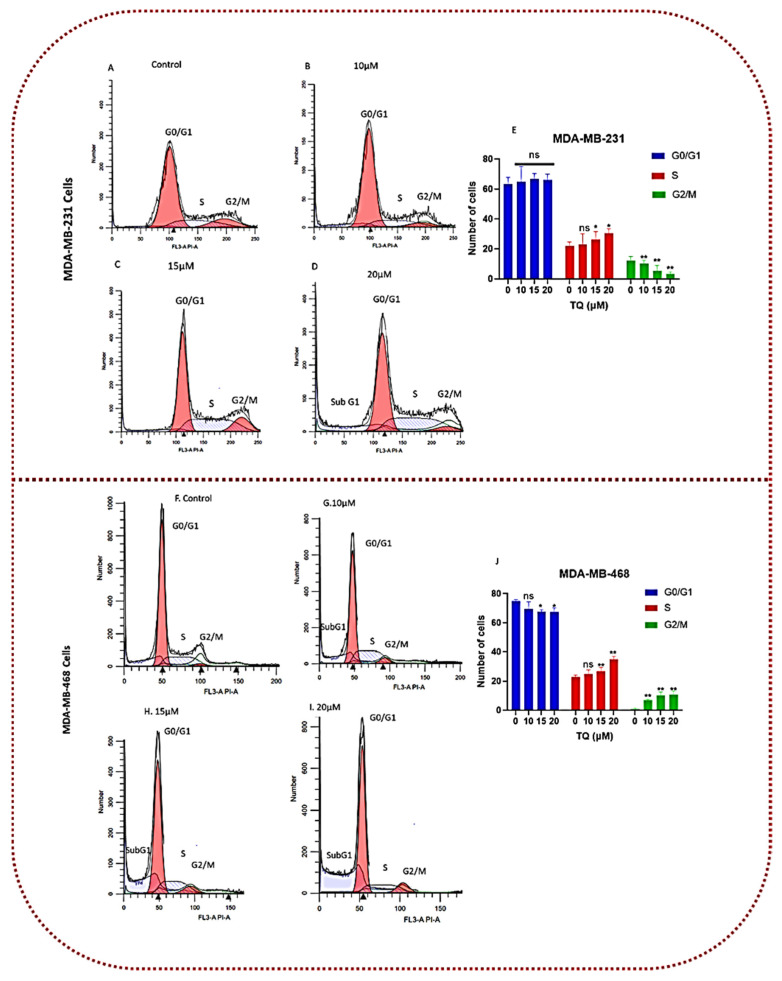
Figure 7.
TQ affects cell cycle distribution in MDA-MB-231 and MDA-MB-468 TNBC cell lines. Both TNBC cell lines were treated for 24 h with TQ at three concentrations ranging from 0 to 20 µM. Sony SH800 cell sorter examination of cell dispersion using PI fluorescence. The histograms of representative Sony SH800 cell sorter experiments are shown (A–D) in MDA-MB-231 cells and (F–I) in MDA-MB-468 cells). Following three replicate studies, the bar graph shows (E,J) the average proportion of cells in each cell cycle phase. In MDA-MB-231 cells, TQ-treated TNBC cells showed an increase in the proportion of S phase cells and a decrease in the proportion of G2/M phase cells, while the proportion of S phase and G2/M increased in MDA-MB-468 cells. The p-value for the difference between the control and treated cells at different cell cycle phases was determined using one-way ANOVA followed by Bonferroni’s multiple comparisons test. At * p < 0.05, ** p < 0.01, the difference was declared significant and nonsignificant (ns).

