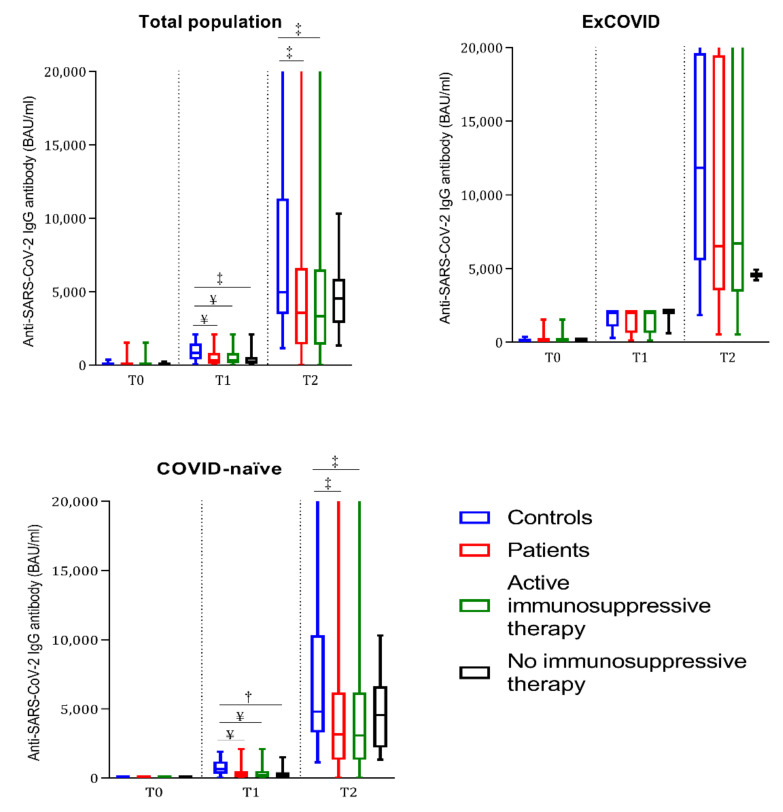
Figure 1.
Boxplots representing anti-SARS-CoV-2 IgG antibody titers prior to the first (T0) and second (T1) vaccine dose and after 4 weeks (T2) in controls, total patients, patients under active immunosuppressive therapy, and patients without immunosuppressive therapy. The total population (ex-COVID plus COVID-naïve) and ex-COVID and COVID-naïve subjects are represented in each graph, respectively. † = p < 0.01, ‡ = p < 0.001, and ¥ = p < 0.0001 compared with the COVID-matched controls at the same time point by Mann–Whitney test.

