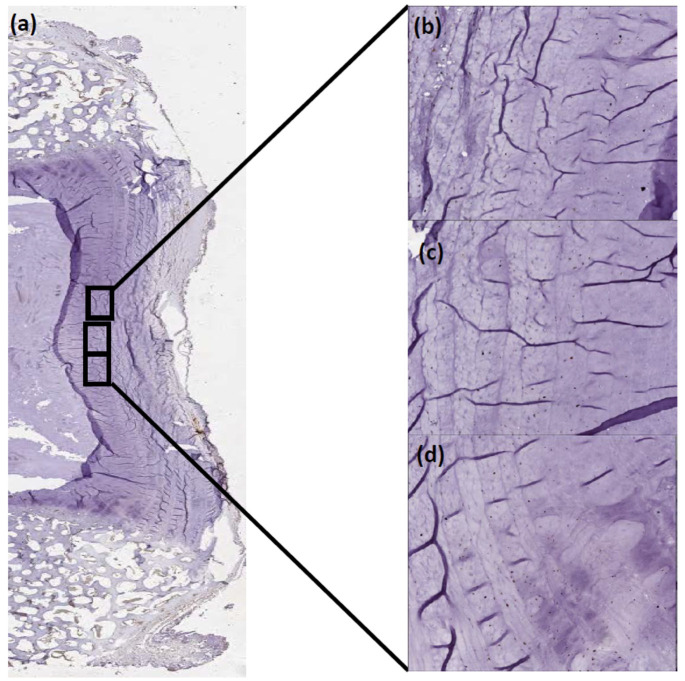
Figure A1.
ROI determination for scanned IVD sections. (a) The posterior aspect of each scanned tissue section was examined at low power (×2-4) and then at higher power (×20). (b–d) Each of three distinct regions at ×20 magnification were selected and immunostained cells were quantified using the Indica Labs IQ4 software programme.

