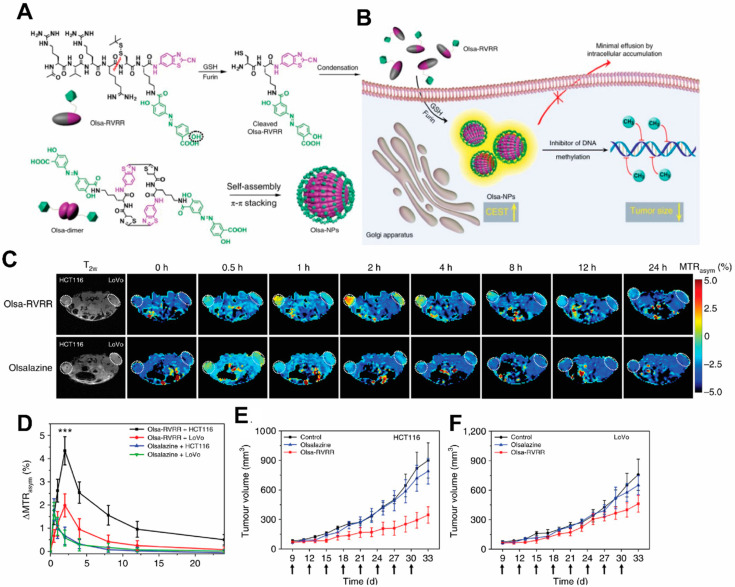
Figure 4.
Schematic illustration for the formation of Olsa-NPs by furin-mediated intracellular reduction and condensation of Olsa-RVRR, resulting in enhanced CEST signal and tumor treatment efficacy. (A) Self-assembly of Olsa-RVRR into Olsa-NPs through a series of steps. Red line indicates the site of furin cleavage, and the circled hydroxyl group indicates the exchangeable hydroxyl proton that provides OlsaCEST signal at 9.8 ppm from the water frequency. (B) After Olsa-RVRR enters the cytoplasm of high furin-expressing cells (the HCT116 colon cancer cells in this study), it undergoes reduction by GSH and cleavage of the peptide by furin near the Golgi complex where cleaved Olsa-RVRR is generated. Amphiphilic oligomers (mostly dimers) are then formed from the click reaction between two cleaved Olsa-RVRR molecules, followed by self-assembly into Olsa-NPs as a result of intermolecular π-π stacking. The intracellular accumulation of Olsa-NPs then serves as a reservoir of Olsa molecule-enhancing CEST contrast and inhibiting DNA methylation for tumor therapy. (C,D) Dynamic T2-weighted (T2w) and OlsaCEST serial MRI of tumor-bearing mice after intravenous injection of 0.2 mmol kg−1 Olsa-RVRR or Olsa (left, HCT116; right, LoVo colon cancer cells). Time course MTRasym maps (C) and MTRasym OlsaCEST signal (D) for tumors after background correction by the subtraction of the MTRasym value at 0 h. Data are shown as mean ± s.d. for n = 4 mice; one-way ANOVA, followed by Dunnett’s post hoc test; ***: p < 0.001 versus all other groups. (E,F) Anti-tumor effects of Olsa and Olsa-RVRR for HCT116 (E) and LoVo (F) tumors. Arrows indicate time points of repeated drug administration (every 3 d × 8) after tumor cell injection. Data are shown as mean ± s.d. (n = 4 mice). The figure is adapted with permission based on Ref. [126]. Copyright 2019 Springer Nature.

