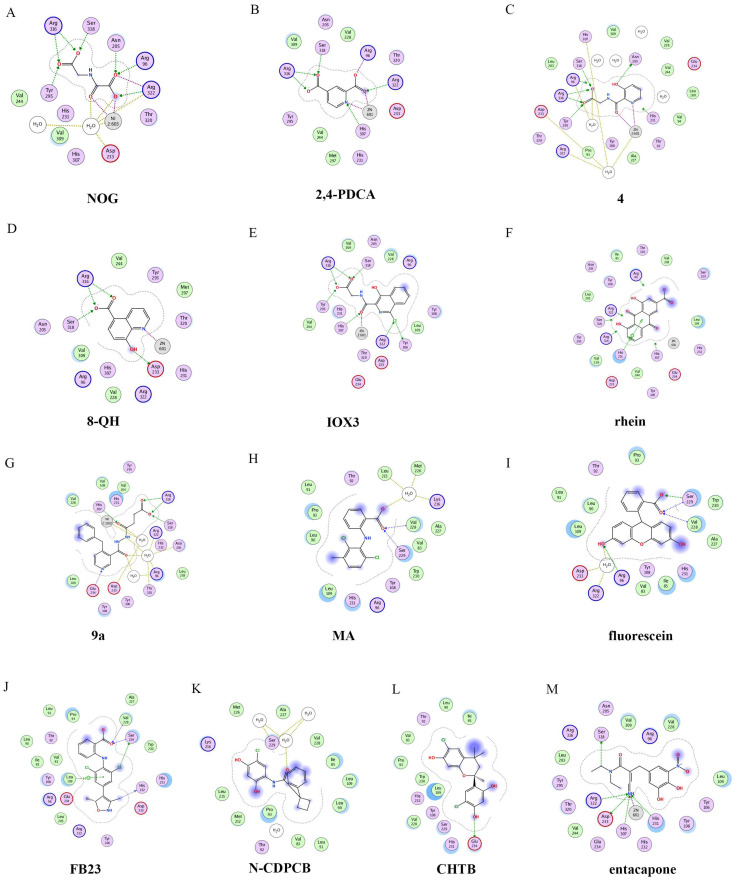
Figure 5.
Two-dimensional representation of ligand–protein interactions of FTO inhibitors with FTO protein using MOE software. In MOE, the polar and non-polar residues are shown in pink and green disks; the water molecules are drawn as white circles; the metal ions are shown in grey circles; the hydrogen bonds are indicated by green dotted lines. (A–M) Ligand interactions of FTO with distinct compounds: (A) NOG (PDB ID: 4IDZ); (B) pyridine-2,4-dicarboxylate (2,4-PDCA, PDB ID: 4IE0); (C) 4 (PDB ID: 4IE5); (D) 8-QH (PDB ID: 4IE4); (E) IOX3 (PDB ID: 4IE6); (F) rhein (PDB ID: 4IE7); (G) 9a (PDB ID: 4CXW); (H) Meclofenamic acid (MA) (PDB ID: 4QKN); (I) fluorescein (PDB ID: 4ZS2); (J) FB23 (PDB ID: 6AKW); (K) N-CDPCB (PDB ID: 5DAB); (L) CHTB (PDB ID: 5F8P); and (M) entacapone (PDB ID: 6AK4).

