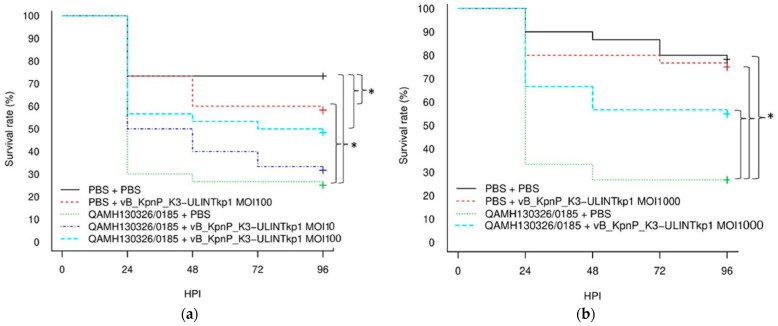
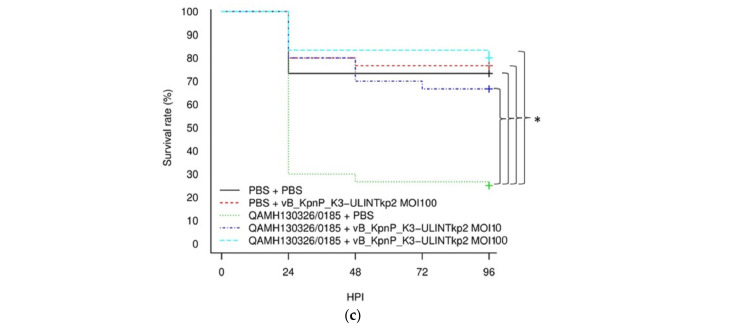
Figure 7.
Kaplan–Meier survival curves of the experiments with G. mellonella larvae inoculated with K. pneumoniae QAMH130326/0185 or PBS and treated with vB_KpnP_K3-ULINTkp1 (a) for MOI = 10, MOI = 100 and (b) for MOI = 1000 or vB_KpnP_K3-ULINTkp2 (c) or PBS 1 h later. Each group contained 30 larvae. MOI: multiplicity of infection; HPI: hours post inoculation; p-value (*) ≤ 0.05 (Log-rank tests).


