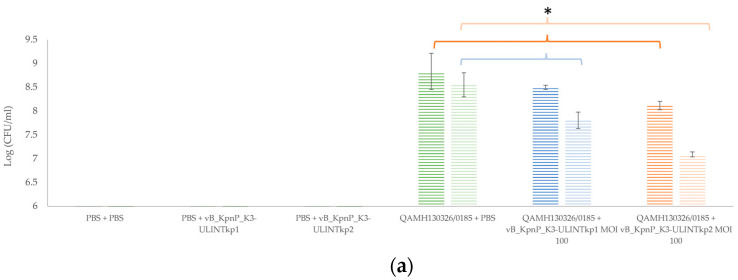
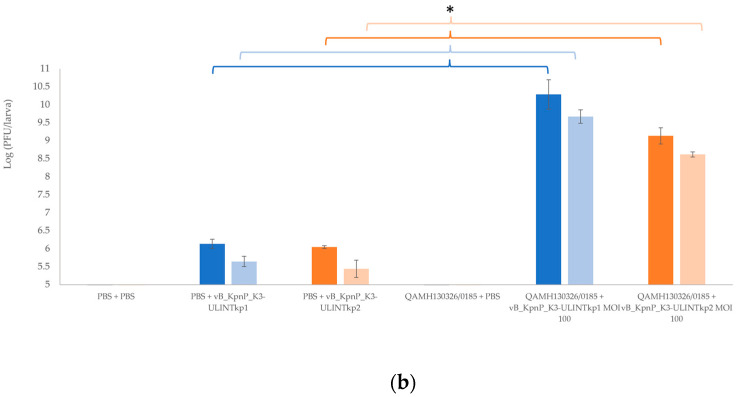
Figure 8.
Bacterial (hatched chart) (a) and bacteriophage (b) titrations at 24 h (dark bars) and 72 h (light bars) after inoculation of the G. mellonella larvae in the titration experiments with the bacteriophages vB_KpnP_K3-ULINTkp1 or vB_KpnP_K3-ULINTkp2 and K. pneumoniae QAMH130326/0185. The mean of 3 titrations (±σ) is represented. The significant results including groups with a titration equal to 0 (PFU/larvae or CFU/larvae) are not shown. MOI: multiplicity of infection. p-value (*) ≤ 0.05.


