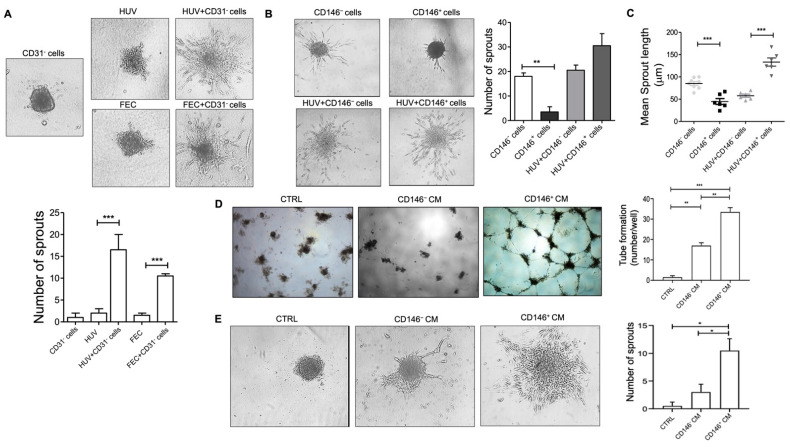
Figure 4.
Sprout formation from ECs and PCs co-culture spheroids. (A) Representative images of sprout formation from ECs-only (HUVECs or CD31+ Fat ECs), and CD31– PCs:ECs (1:5) co-culture spheroids embedded in type I collagen gel at 24 h (magnification, 20×). The quantitative graph shows sprout numbers formed from CD31− PCs- or ECs-only (HUVECs or CD31+ fat ECs), compared to co-culture spheroids (mean ± SD, n = 3). (B) Sprout formation from CD146− and CD146+ PCs-only, and PCs + ECs (HUVECs) co-culture spheroids in collagen after 24 h of embedding (magnification, 20×). The quantitative graph displays the number of sprouts at 24 h from PCs-only and PCs:ECs (1:5) co-culture spheroids (mean ± SD, n = 3). (C) The scatter plot displays the mean sprout length (in µm) per spheroid at 24 h (mean ± SD, n ≤ 6). Images are representative of one out of three independent experiments with similar results performed in triplicates. (D) HUVECs were seeded on BME-coated plates and stimulated with CM from CD146− and CD146+ pericytes in culture. Images were taken after 24 h of plating the assay (original magnification, 10×). HUVECs treated with EGM complete medium were used as a control. The number of cords was counted as a parameter for the quantification of tube formation. (E) The 3-D spheroids assay of HUVECs in the presence of CM from CD146− and CD146+ cells. HUVECs treated with EGM complete medium were used as a control. Images were taken after 24 h at 10× magnification. Images are representative of one out of two independent experiments with similar results performed in triplicates. Statistical analysis was performed by one way ANOVA and Bonferroni’s post-test; * p ≤ 0.05, ** p < 0.01, *** p < 0.001. HUV—human umbilical vein endothelial cells; FEC—endothelial cells from fat tissue.

