Figure 5.
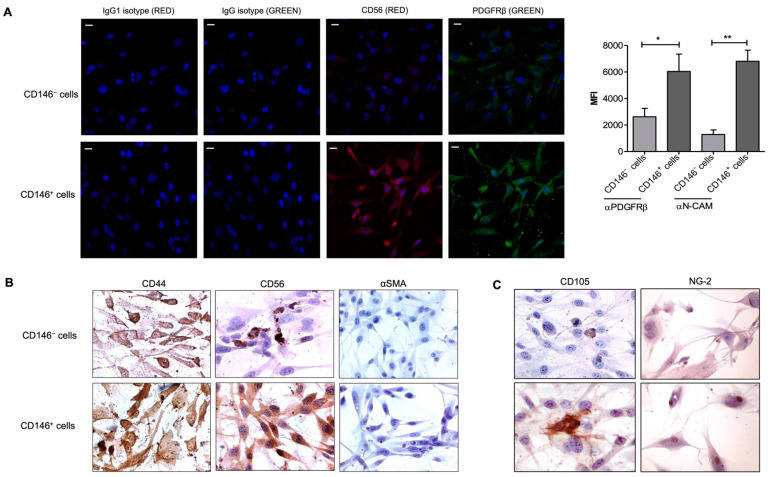
Expression of CD56 (NCAM). (A) Representative confocal images of CD146− cells (upper side) and CD146+ (lower side). Immunofluorescence was performed to identify PDGFRβ and CD56 expression by both the cell subpopulations. Images display PDGFRβ in green, CD56 in red, and cell nuclei in blue; magnification, 40×. Scale bar = 25 μM. The corresponding IgG- (green) or IgG1-isotype (red) was used as a negative control. The bar graph was generated using the mean fluorescence intensity of two different experiments performed in triplicates. One-way ANOVA and Bonferroni’s post-test were used to compare the data; * p ≤ 0.05, ** p < 0.01. (B) CD146− (upper) and CD146+ (lower) cells were stained for peculiar mesenchymal markers CD44, CD56 (NCAM), and αSMA. Images were taken at 60× magnification. (C) Immunostaining images represent CD146− (upper) and CD146+ cells (lower) for the expression of common mesenchymal markers, CD105 and NG-2 at 40× and 20× magnification, respectively. Images are representative of one out of three experiments performed in duplicates. NCAM—neural cell adhesion molecule (CD56).

