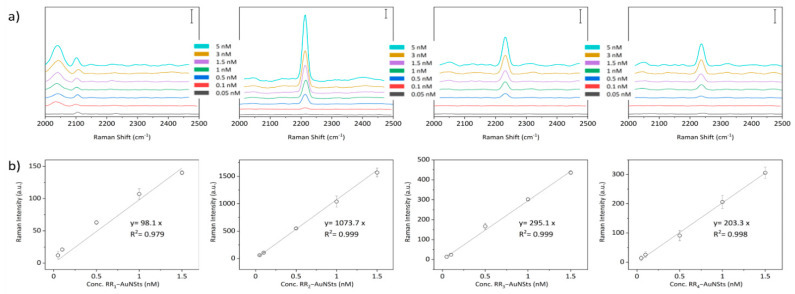
Figure 6.
(a) Raman-SERS spectra acquired against RR@AuNSts colloidal solutions at decreasing concentrations, ranging from 5 nM to 0.05 nM. Scale bar is 500 counts in all cases. (b) Linear concentration dependence of Raman intensity of the characteristic vibrational peak of the different RR@AuNSts nanoprobes (n = 3; error bars represent standard deviation. Solid line shows a linear fitting).

