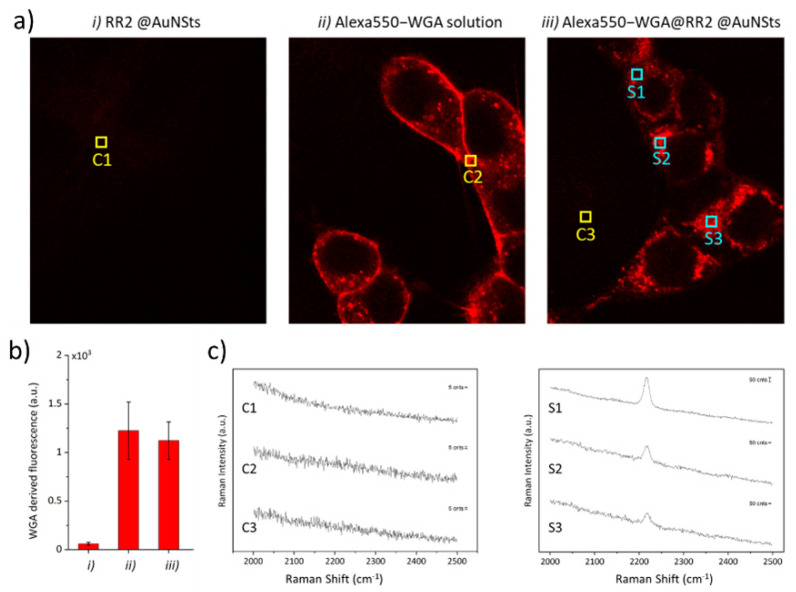
Figure 7.
(a) Representative confocal microscope images of HEK cells incubated with RR2@AuNSts, free WGA solution, and Alexa550-WGA@RR2@AuNSts. Scale bar is 100 µm in all cases. (b) Histogram showing the quantitative values of WGA fluorescence measured for the three samples after background subtraction. Error bars are standard deviations. (c) SERS spectra from random regions in (a), indicated by colored squares (C—control; S—sample).

