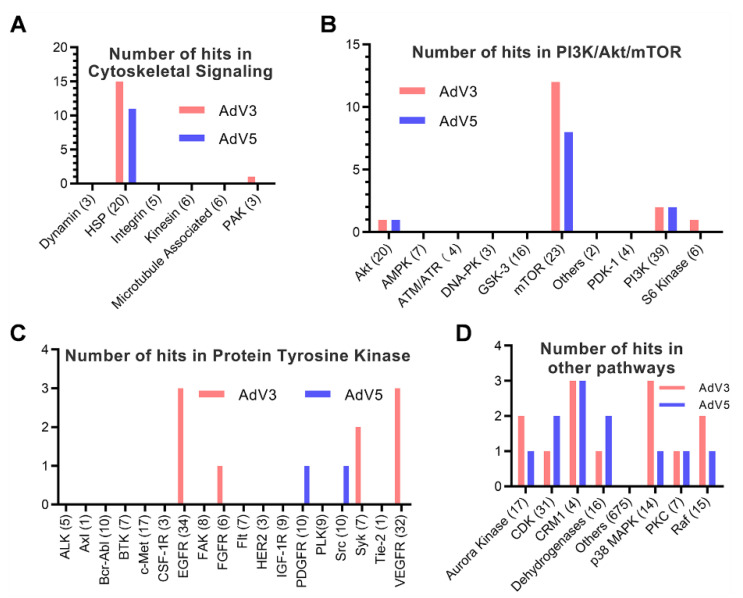
Figure 3.
Analysis of the targets of hit compounds from the secondary screen. The target distribution analysis shows that drug targets of all hit compounds in the secondary screen can be categorized into four groups. (A) Cytoskeletal signaling. (B) PI3K/Akt/mTOR. (C) Protein Tyrosine Kinase, and (D) other pathways. The total compound number in each category is indicated in parentheses. The number of hits in each category is shown on the Y-axis.

