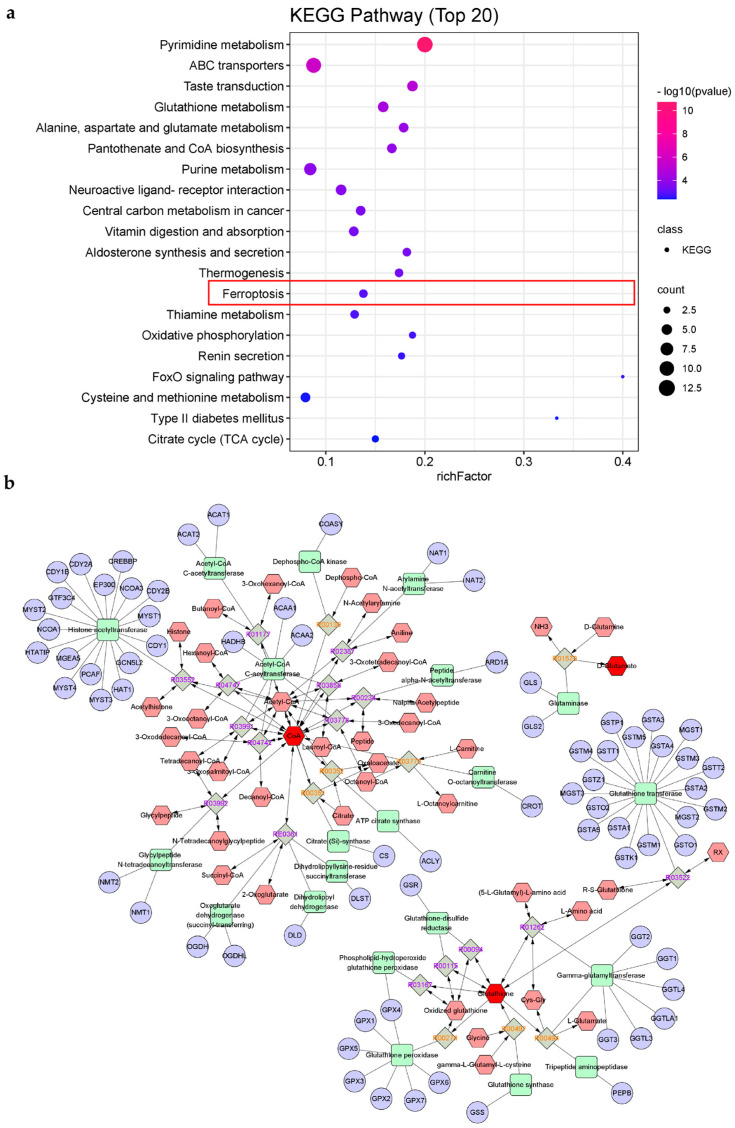
Figure 5.
KEGG pathways of AUM-1 treated RAW264.7 cells. (a) Bubble diagram of the top 20 KEGG pathways, the ferroptosis pathway was emphasized in the red border. (b) Compound-reaction-enzyme-gene networks of the significantly DAMs in ferroptosis. The red hexagons, grey diamonds, green rectangles, and purple circles represent the metabolites, reactions, proteins, and genes, respectively.

