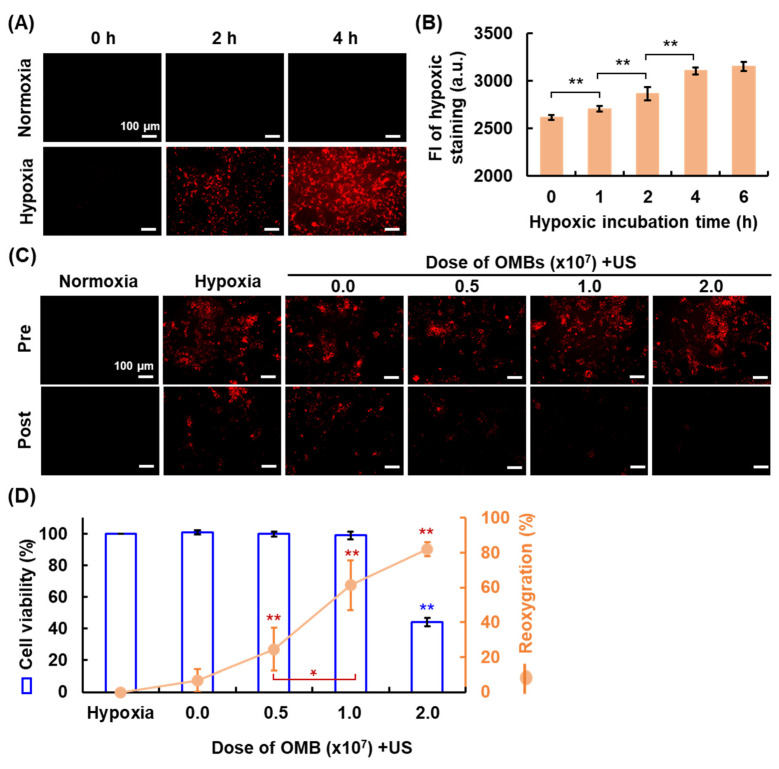
Figure 6.
The hypoxic tumor cell model and reoxygenation. (A) Fluorescent images reveal HDR cells stained red by Image-iTTM Red hypoxia reagent. (B) The corresponding quantification data for FI on cell imaging (** p < 0.01). The optimal dose of OMB for cell reoxygenation after OMB treatment was determined by (C) the fluorescent cell imaging and (D) the correlation between cell viability and the percentage of reoxygenation (* p < 0.05, ** p < 0.01).

