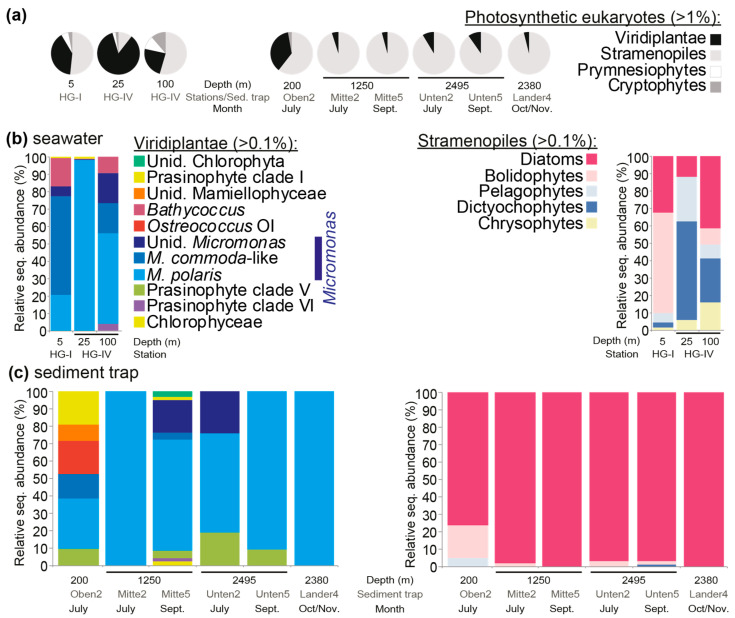
Figure 2.
Eukaryotic phytoplankton composition in summer 2010 at the HAUSGARTEN LTER. (a) Relative abundance of V1-V2 16S rRNA gene amplicons from major groups of plastid-containing organisms. Upper water column data come from stations HG-I and HG-IV, based on sampling on 12 July 2010, and data from moored sediment traps come from sample collections in summer and autumn 2010. Only groups detected at >1% at the respective sites/traps are shown. (b) Relative abundance of different Viridiplantae groups (green algae), largely prasinophyte algae, and also of stramenopile groups, relative to the total for each group in the respective surface-layer-water samples. (c) The same as (b) except that the data are from trap samples. In all cases, amplicons were taxonomically assigned using Phyloassigner following the methodology and alignments used in Choi et al. (2020); the color coding in (c) is the same as in (b).

