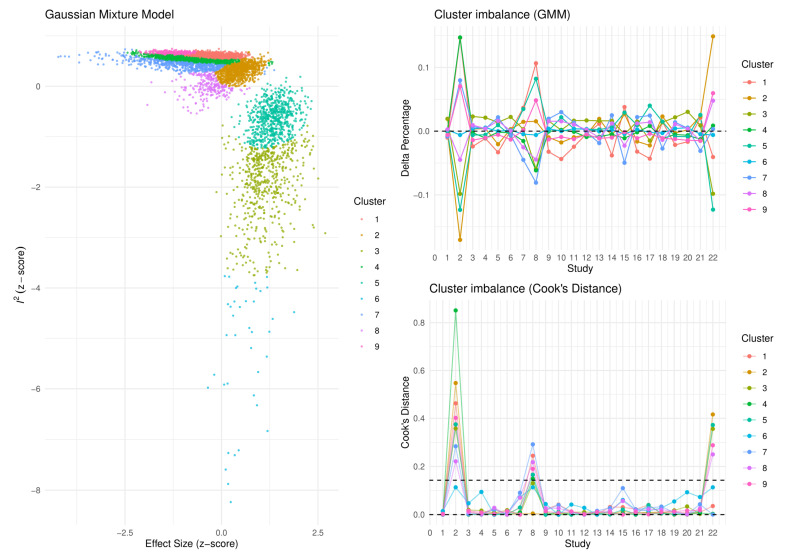
Figure 3.
Graphic display of study heterogeneity (GOSH) plots of FMD difference between NAFLD and control subjects, showing the clusters that act as influential outliers towards between-study heterogeneity (I2) and overall effect size. A combinatorial meta-analysis was performed, including 2k−1 analyses, with k representing the number of interventions. The summary effects of those meta-analysis models (horizontal axis) and the heterogeneity (vertical axis) were illustrated graphically. Studies were considered influential in case their Cook’s distance was over the calculated threshold.

