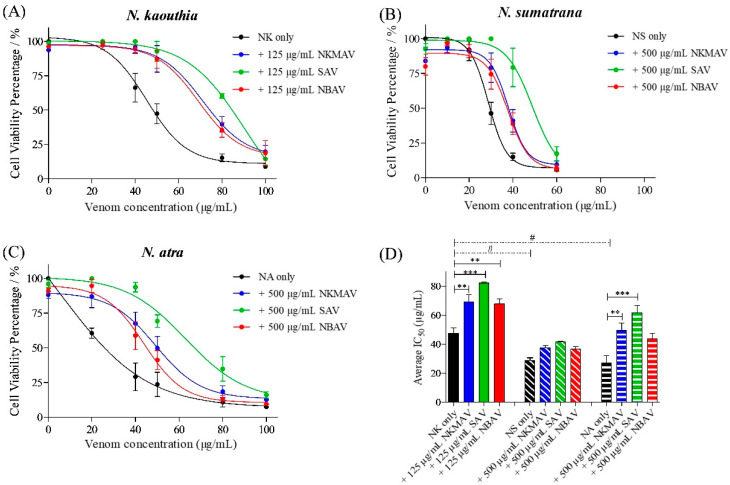
Figure 4.
Cytotoxicity of cobra venoms and their neutralization by antivenoms on the CRL-2648 cell lines. Cell viability plot of mouse fibroblast cell line treated with N. kaouthia (NK; A), N. sumatrana (NS; B), and N. atra (NA; C) venoms and their neutralization by cobra antivenoms (NkMAV, SAV, and NBAV). Average IC50 of venoms of NK, NS, and NA and neutralization with cobra antivenom (D). The assay represents biological and technical triplicates. One-way ANOVA with Tukey’s post hoc test was used in determining statistical significance. ** and *** represents statistical significance between venom IC50 and antivenom neutralized IC50 within the respective cobra group, p < 0.001 and p < 0.0001 respectively. # Represents statistical significance between venom IC50 of cobra species, p < 0.01.

