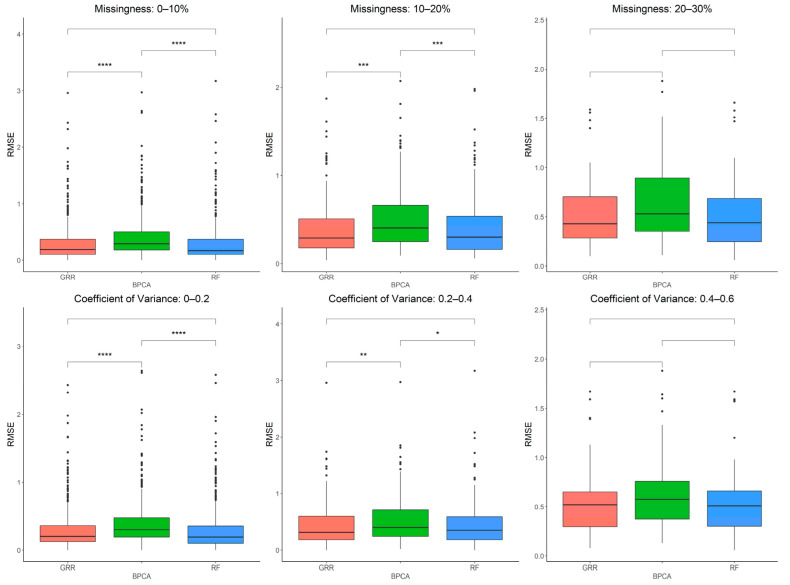
Figure 6.
Evaluations of imputation accuracy in the complete baboon liver. Accuracy is evaluated for a mixture of missingness types (MCAR–MAR–MNAR). Methods are listed across the x-axis, and RMSE is shown on the y-axis. The top row compares accuracy across a range of missingness types. The bottom row compares accuracy across a range of coefficients of variance. The center line represents the median. The lower and upper box limits represent the 25% and 75% quantiles, respectively. The whiskers extend to the largest observation within the box limit ± 1.5 × interquartile range. Black dots represent single iterations of evaluating RMSE that are outliers. The p-values are based on pairwise testing with the Wilcoxon Rank Sum test (* corresponds to p ≤ 0.05; ** corresponds to p ≤ 0.01; *** corresponds to p ≤ 0.001; **** corresponds to p ≤ 0.0001).

