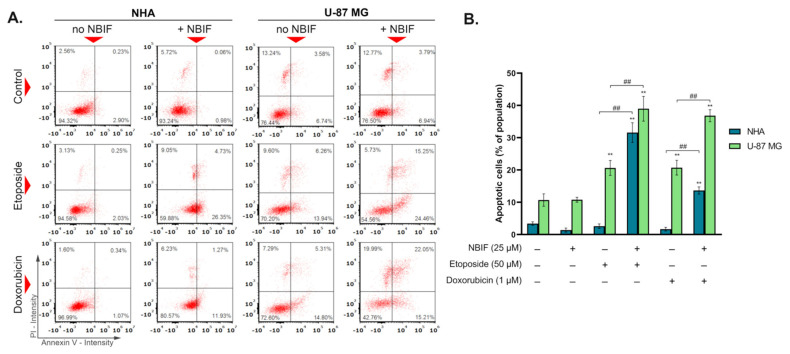
Figure 2.
The results of Annexin V assay after 48 h of the incubation of NHA human astrocytes and U-87 MG glioblastoma cells with etoposide (50 μM) or doxorubicin (1 μM) alone and in combination with NBIF (25 μM). (A) Representative scatter plots present cell population divided into four quadrants: healthy cells (lower left), early apoptotic cells (lower right), late apoptotic cells (upper right) and non-apoptotic dead cells (upper left). (B) Mean values and SD of percentage of the annexin V-positive cells (bar graph) from three independent experiments in at least triplicate. The results are presented as percent of whole population. ** p < 0.001 vs. control; ## p < 0.001 for comparisons between groups. PI—propidium iodide.

