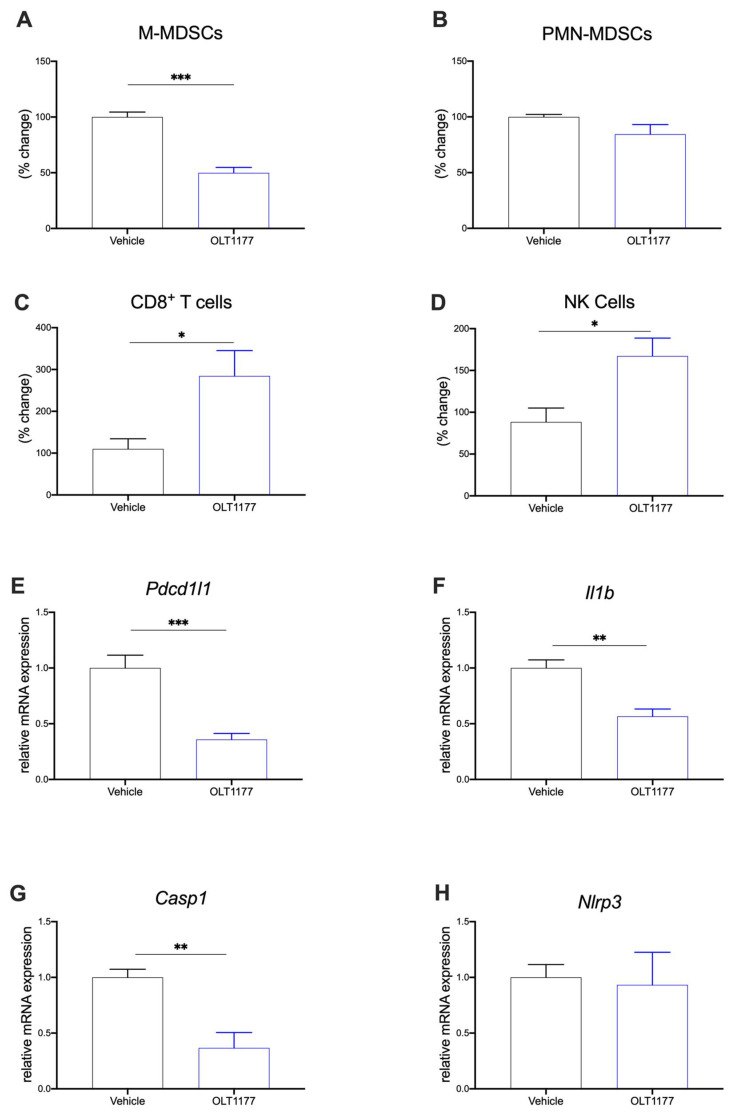
Figure 3.
NLRP3 drives immunosuppressive TME. (A–D) Flow cytometry analysis of primary tumors in mice fed standard or OLT1177 diet. (A) Levels of M-MDSC in primary tumors of mice fed standard or OLT1177 diet (n = 5). (B) Levels of PMN-MDSC in primary tumors of mice fed standard or OLT1177 diet (n = 5). (C) Levels of CD8+ T cells in primary tumors of mice fed standard or OLT1177 diet (n = 5). (D) Levels of NK cells in primary tumors of mice fed standard or OLT1177 diet (n = 5). (E–G) Mean ± SEM of relative mRNA expression of Pdcd1l1 (E), Il1β (F), Casp1 (G) and Nlrp3 (H) from primary 4T1 tumors in mice fed standard or OLT1177 diet (n = 6). *** p < 0.001, ** p < 0.01, * p < 0.05.

