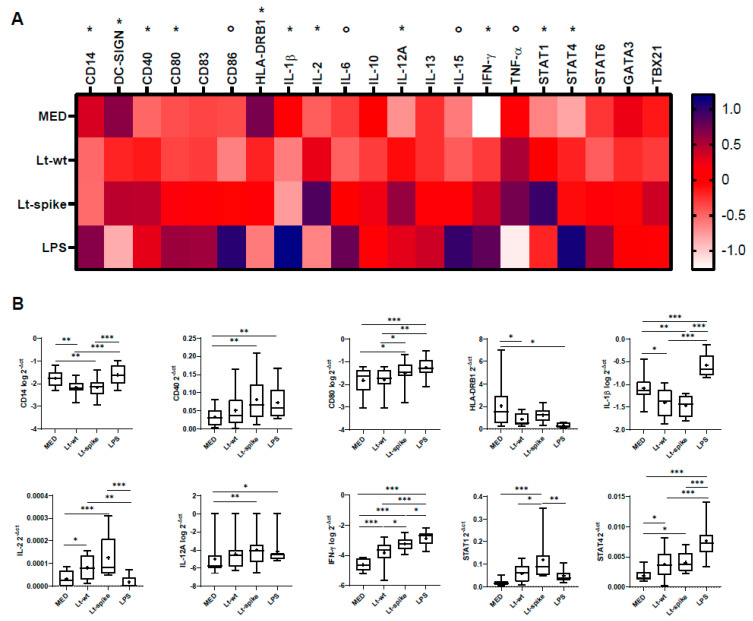
Figure 7.
Immunological responses of L. tarentolae-infected DCs (RT-qPCR). mRNA expression of genes involved in the immune response in DCs exposed to Lt-wt and Lt-spike for 24 h. DCs derived from healthy donors (n = 9). (A) Gene expression (mean values) is shown as a color scale from white to blue (heatmap); variables, either on the original scale or log10-transformed (see Table S1), were standardized (mean = 0, SD = 1) to facilitate comparisons; * = at least one Leishmania cell treatment (Lt-wt/Lt-spike) significantly different (p < 0.05) from MED at post-hoc tests; ° = no Leishmania cell treatment significantly different (p > 0.05) from MED at post-hoc tests. (B) Box-plots (median, 25th and 75th percentiles, minimum and maximum values) of statistically significant markers, indicated in panel A with *. The symbol + indicates the mean value. Statistically significant differences at post-hoc tests are indicated; * p < 0.05; ** p < 0.01; *** p < 0.001. MED: untreated DCs.

