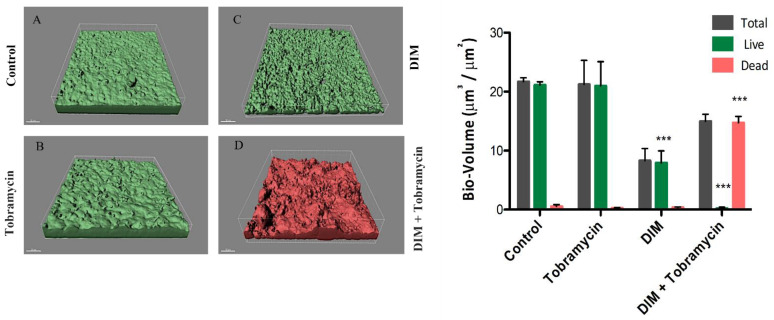
Figure 2.
Destruction of mature, differentiated biofilm of P. aeruginosa PA01. CLSM images of biofilm formed in a flow system after 120 h (A) and continuous supplementation with (B) 20 μg mL−1 tobramycin, (C) 50 μM DIM, and (D) a combined treatment of 50 μM DIM with 20 μg mL−1 tobramycin, three independent repetitions. Biofilms were stained with the LIVE/DEAD bacterial viability kit. Quantification of bio-volume: live, dead, and total bio-volumes (μm3/μm2) were calculated based on image analysis and data from the IMARIS software. Differences were analyzed for their significance by using one-way ANOVA with Tukey’s test. *** p < 0.0001.

