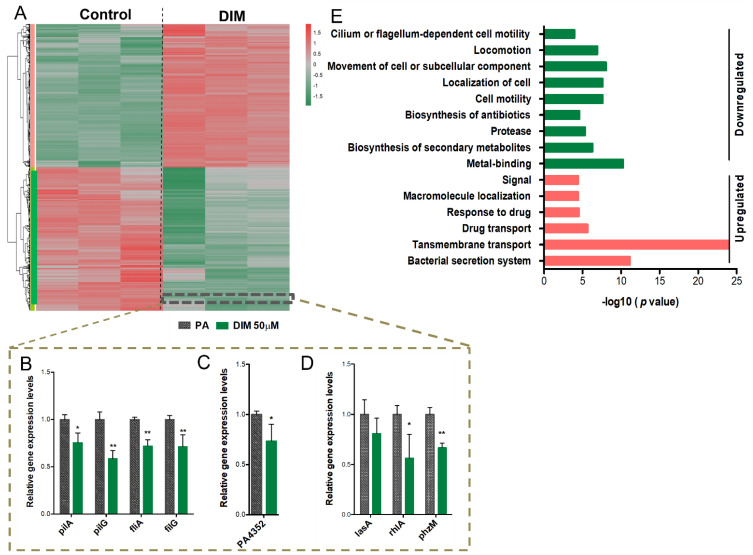
Figure 3.
Heterogeneity in gene expression of P. aeruginosa PA01 in response to 50 µM DIM. Hierarchical clustering and heat map of RNA-seq data (A). Counts were normalized with DeSeq2 and then transformed via log 2 prior to clustering and visualization. Genes were considered differentially expressed if they had FDR-adjusted p-value < 0.05 and absolute fold change (in linear scale) ≥ 1.3. Downregulation of a gene is indicated in green, and upregulation is indicated in red. The dashed box denotes genes whose expression was further verified by RT−PCT: motility−associated genes (B), stress response gene (C), and virulence encoding factors (D). The relative magnitude of gene expression level was defined as the copy number of cDNA of each gene normalized by the copy number of cDNA of the housekeeping gene, proC. Error bars indicate the SD of at least three measurements. ** p < 0.005 vs the control. * p < 0.05 vs control. Genes that were differentially expressed (log 2fold change (FC) ≥ 1.3) in the transcriptional profile were assigned to David’s functional annotation chart (combined heterogeneous annotations). The enrichment of functional categories representing both downregulated pathways (green) and upregulated ones (red) (E). Categories with significantly enriched genes are depicted as FDR < 0.05 and p-value ≤ 0.05, while log10 (p-value) is indicated at the x-axis.

