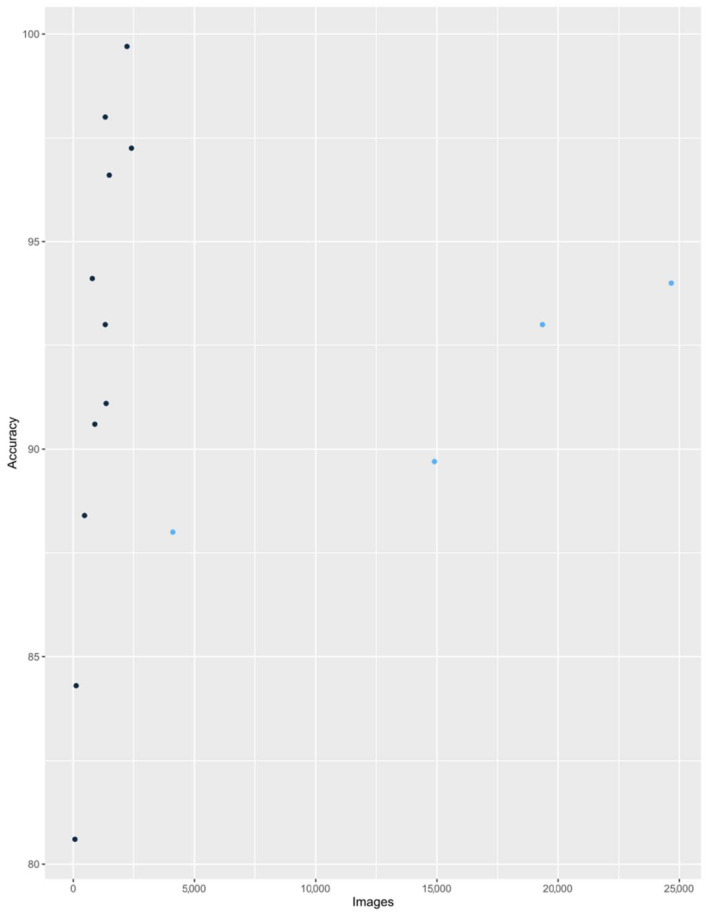
Figure 3.
Dot plot of the accuracy of included studies (there are more dots than studies because some research analyzed more than one classification of laryngeal lesions). The dark blue points represent the group of studies for which the linear regression equation was calculated. The remaining studies are marked with light blue points.

