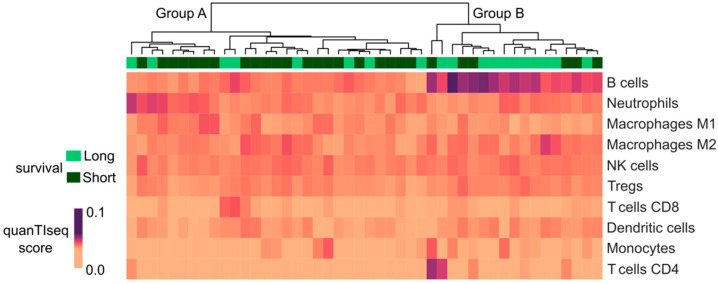
Figure 2.
Evaluation of immune infiltrating cells through the quanTIseq deconvolution approach. From the top downwards: unsupervised clustering of the ePM cohort divided into Group A and Group B. The green line represents survival: long survivors in light green; short survivors in dark green. The heatmap shows the quanTIseq score through a range of colors as in the legend: the darker the color, the higher the score.

