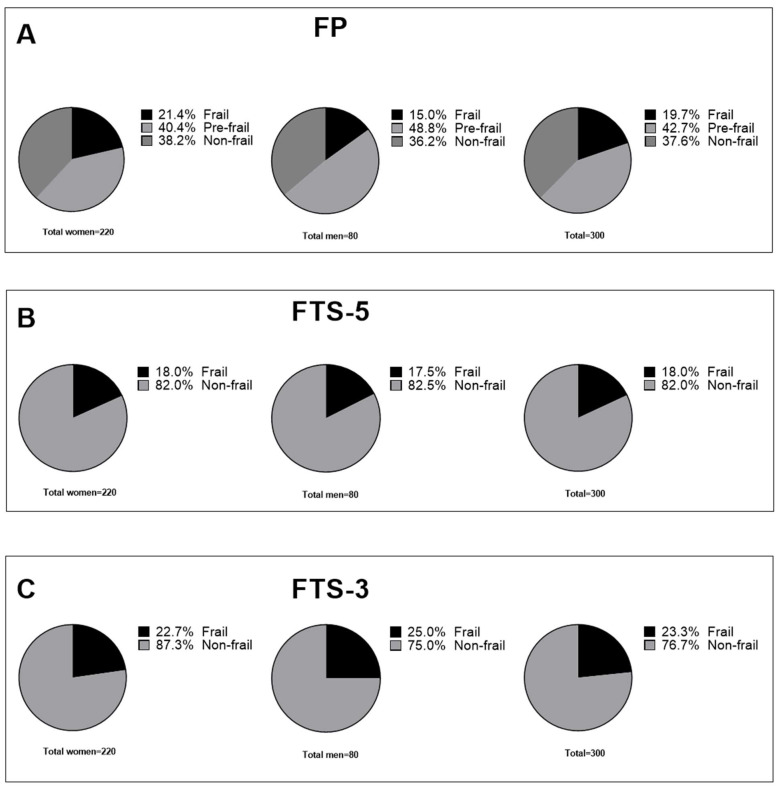
Figure 1.
Distribution of frailty syndrome by FP, FTS-5, and FTS-3. (A) Distribution of frailty syndrome in women, men, and all participants, according to Fried phenotype. (B) Distribution of frailty syndrome in women, men, and all participants according to FTS-5. (C) Distribution of frailty syndrome in women, men, and all participants according to FTS-3. FTS-5, Frail Trait Scale 5; FTS-3, Frail Trait Scale 3; FP, Fried Phenotype.

