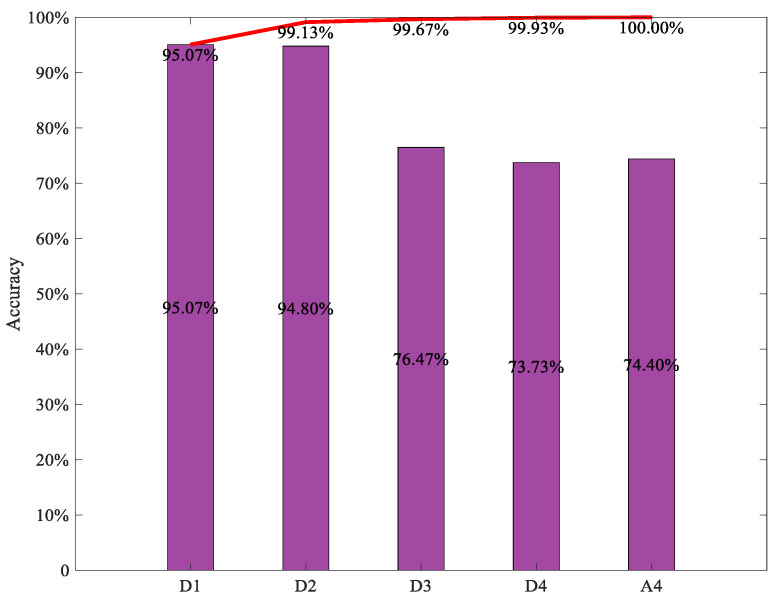
Figure 13.
Diagnosis accuracy of the integrated ViT models with first n ViT. The histogram indicates the diagnosis accuracy of the individual ViT with different TFR maps respectively, the red curve indicates the diagnostic accuracy of the integrated ViT model with the first n TFR maps of subsignals.

