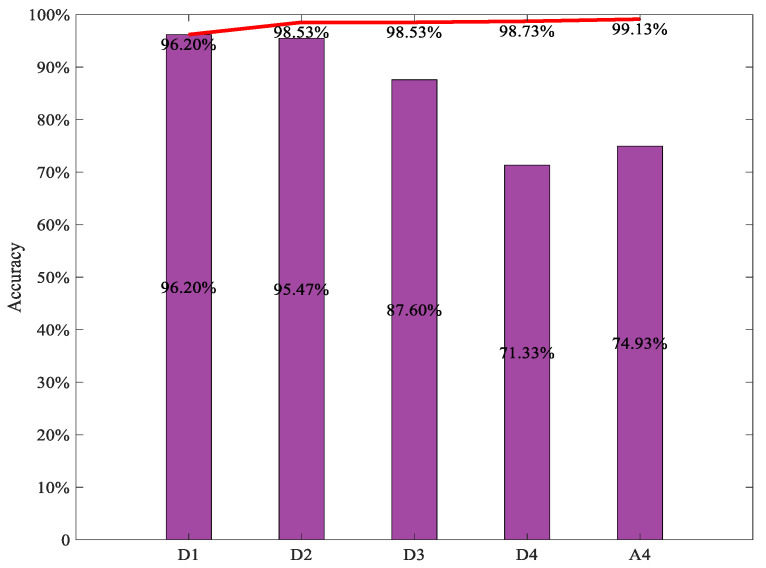
Figure 14.
Diagnosis accuracy of integrated CNN using the first n individual CNN. The histogram indicates the diagnosis accuracy of the individual ViT with different TFR maps respectively, the red curve indicates the diagnostic accuracy of the integrated ViT model with the first n TFR maps of subsignals.

