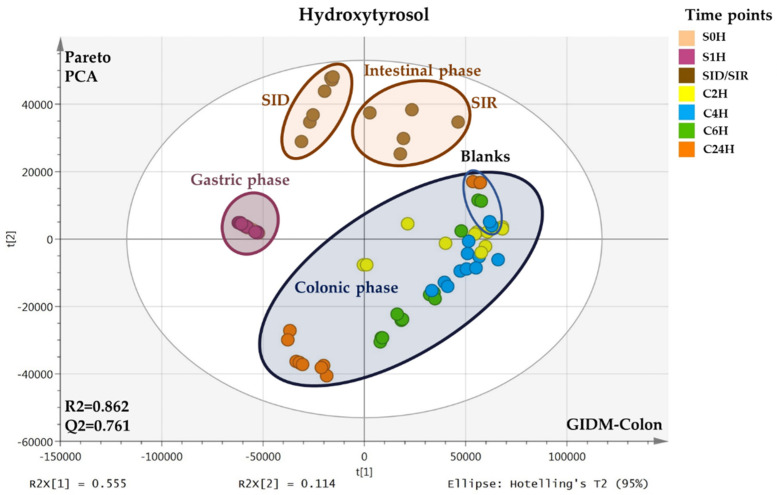
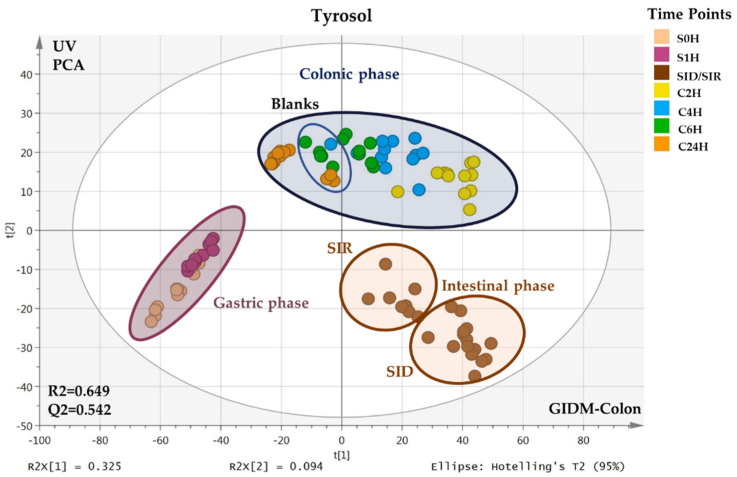
Figure 1.
PCA scores plots of HTyr (upper) and Tyr (down) samples from the GIDM–colon experiment acquired via UPLC–ESI(-)–HRMS. Observations are color coded according to the time points of sample collection: S0H, S1H, SID/SIR, C2H, C4H, C6H, C24H. Compartments are highlighted with different colors: Gastric phase (magenta), intestinal phase (brown), and colon phase (dark blue). The blue circled subgroup in the colonic phase corresponds to the colon blank samples (without HTyr or Tyr, respectively).


