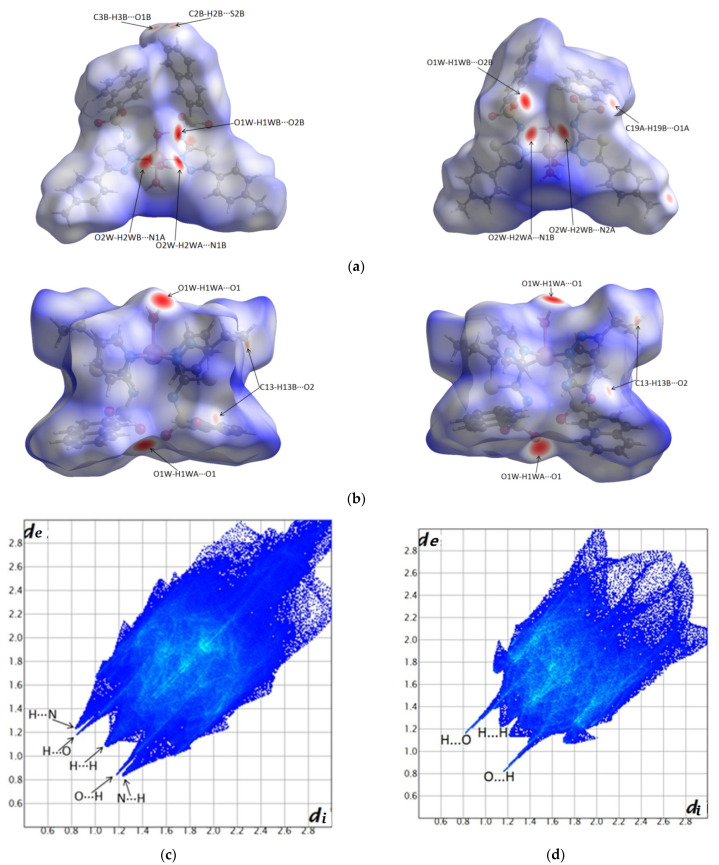
Figure 10.
Front and back perspectives of the Hirshfeld surfaces mapped with dnorm displaying the intermolecular contacts referred to in Table S3 in the Supplementary Material: C1 (a) and C2 (b). Surfaces are represented with the color scale as follows: −0.44 (red) to 2.9 (blue) for C1 and −1.27 (red) to 1.78 (blue) for C2; fingerprint plots of C1 (c) and C2 (d).

