Figure 2.
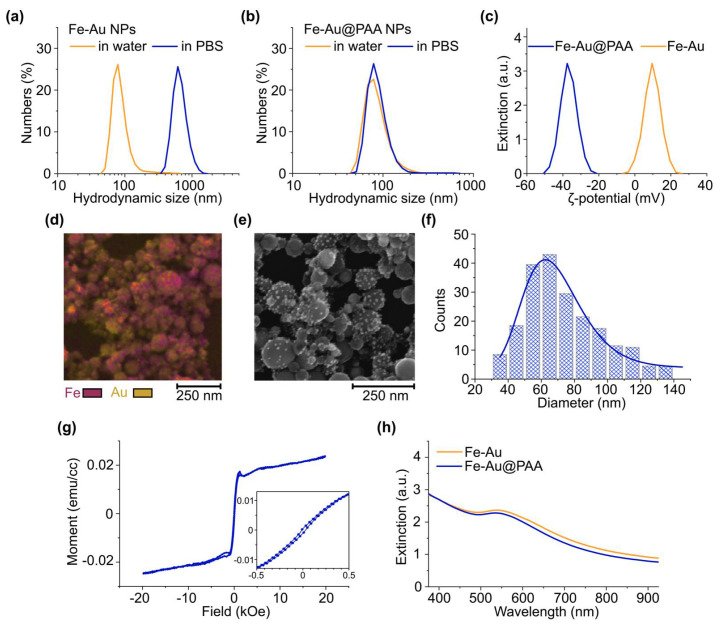
Fe-Au NP characterization before and after stabilization with a polymer coating. (a,b) Hydrodynamic size distribution of Fe-Au (a) or Fe-Au@PAA (b) NPs in water and PBS. (c) ζ-potential distributions of Fe-Au nanoparticles before and after the coating with PAA. (d) EDS mapping of Au and Fe abundance in nanoparticles. Scale bar—250 nm. (e) SEM image of Fe-Au@PAA NPs. Scale bar—250 nm. (f) Distribution of Fe-Au@PAA NP physical diameter. (g) Magnetization curves of Fe-Au NPs measured at 300 K. The inset is an enlarged view of the low-field region. (h) UV-Vis spectra of Fe-Au NPs before and after the PAA coating.

