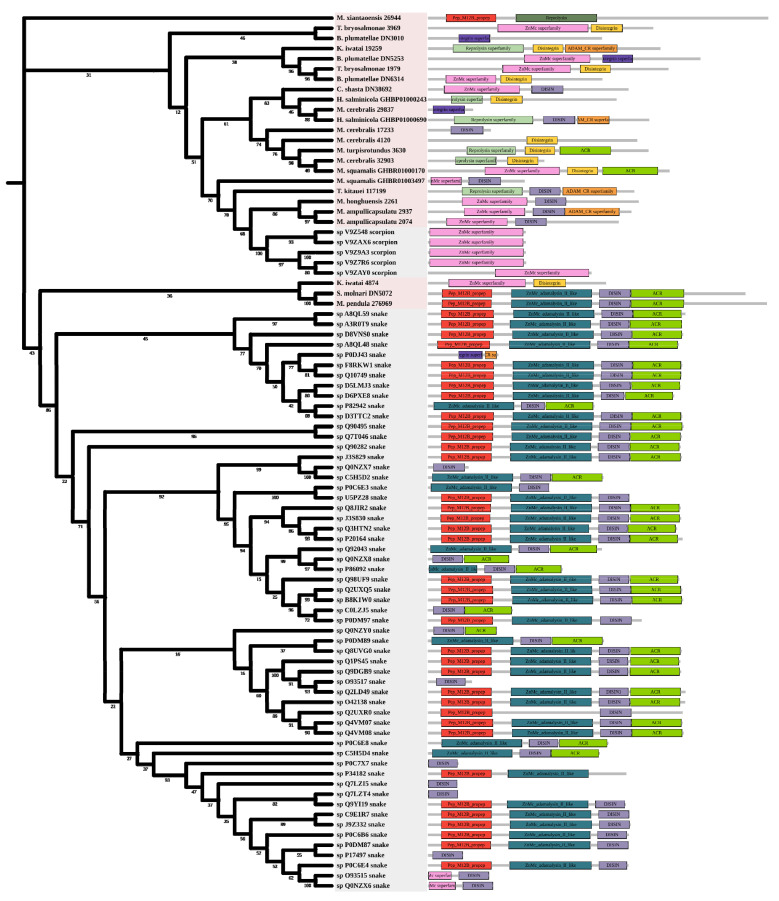
Figure 6.
Phylogenetic tree of the M12B venom protein family. The maximum likelihood (ML) tree was constructed based on amino acid sequences using IQ-TREE version 2.1.1 software. The numbers below nodes show bootstrap support values from 1000 replicates. ML phylogram was generated from amino-acid alignments of M12B homologs using the auto model. The location and length of conserved domains for each amino acid are displayed on the right. Putative sequences outlined in pink, purple, and grey are from myxozoans, free-living cnidarians, and other toxic organisms.

